¶ ENG-411 2026 study report
STARDUST
Satellite for Tracking And Research of atmospheric Dust Using Spectroscopic Techniques
Characterizing the Cosmic Dust and Space Debris Environment in Low Earth Orbit
¶ Report Status
Version: I01
Reviewed by: Mathieu Udriot and Marnix Verkammen
Review date: 30/04/2026
Review status: ✅DONE
The following contains all the relevant informating resulting from this study, from the context and mission objectives to lessons learned.
For a list of terms and acronyms often used, check the Glossary section.
¶ Team
This study was performed at eSpace Concurrent Design Facility by the following team:
| Name | Affiliation | Role |
|---|---|---|
| Udriot Mathieu | External lecturer | Facilitator |
| Verkammen Marnix | External lecturer | Facilitator |
| Hellmich Stephan | eSpace | Facilitator |
| Feyzi Abdullah | eSpace | Facilitator |
| Sterken Veerle | eSpace | Customer |
| Hosoyamada Makoto | EPFL | Attitude & Orbit Control (AOC) |
| Jorand Hugo Téo | EPFL | Communications & Data Handling (CDH) |
| Boisel Rafaël Jules Valentin | EPFL | Propulsion |
| Cvetkovska Melani | EPFL | Structure and mechanism |
| Guasch Mesià Enric | EPFL | Systems Engineering |
| Heeb Ramon | EPFL | Trajectory analysis |
| Van Der Kuyl Jan Alexander | EPFL | Trajectory analysis |
| Maalouf Rayane | EPFL | Sustainability |
| Sánchez-Moreno Royer Pedro | EPFL | Power |
| Sivakumar Briyan | EPFL | Configuration |
| Truchot Antoine | EPFL | Thermal |
¶ AI Use
AI tools were used in this report, following the EPFL guidelines for using (Gen)AI in studying.
Claude / ChatGPT were used to improve writing, getting feedback on report completeness (guidelines comparison), generate the title page and table of contents, and re-factor section titles.
¶ Introduction
Background: This study took place within the ENG-411 Concurrent Engineering course given through the Space Technologies minor at the EPFL. Presented by customers Veerle Sterken and Stephan Hellmich, it addresses the growing environmental challenges posed by space debris and cosmic dust and serves as a learning opportunity for students to apply concurrent design principles.
Objective: With the launch of over 1,750 tons of payloads in 2025 alone [1], the orbital environment has become increasingly congested. Current data suggests that satellite re-entries now inject more metals into the Earth's atmosphere than natural meteors, highlighting the need for in situ measurements to refine atmospheric models and understand these anthropogenic impacts.
Scope: The mission scope involves a Phase 0/A conceptual design for a satellite system able to deploy two payloads. The spacecraft will be equipped with a Time-of-Flight Mass Spectrometer and a piezoelectric dust counter, capable of measuring the flux, chemical composition, and orbital parameters of (sub)-micrometer-sized particles. The system will deliver data for understanding the anthropogenic metallic influx into Earth's atmosphere and the temporal and spatial variability of the cosmic dust and space debris environment.
¶ Executive Summary
The mission aims to characterize the cosmic dust and space debris environment in Low Earth Orbit. To fulfill its scientific goals, the spacecraft is designed to orbit up to 2,000 km, operate for a minimum of five years, launch on a European vehicle, and remain within a 170 M€ budget cap.
The key design drivers and constraints identified prior to the study were the harsh radiation environment at the target orbit, the high ΔV demand imposed by the trajectory, the scientific requirement for continuous measurements, and the programmatic constraints of a European rideshare launcher.
The study developed the full preliminary mission architecture through a concurrent engineering process, covering all major subsystems.
The final design is launched into orbit by an Ariane 62, operates in a Sun-Synchronous Orbit (SSO) from 500 km to 2,000 km over the mission duration of 5 years, and successfully closes all mass, power, and cost budgets within their allocated margins. It also confirms post-mission disposal in compliance with ESA debris mitigation guidelines within the five-year goal.
¶ Results
¶ Systems Engineering
¶ Subsystem requirements
Systems Engineering owns the top-level mission envelope and ensures that every subsystem decision remains consistent with the customer statement. The flowed-down requirements are grouped into three themes: mission-level / programmatic constraints, science flow-down, and operational envelope.
Mission-level and programmatic:
- REQ-01 (Mission Statement): The mission shall design, build, and operate a spacecraft carrying dust and debris detection instruments in LEO to characterize the cosmic dust and space debris environment and its temporal evolution.
- REQ-02 (European Launcher): The mission shall launch on a European vehicle into the target Sun-synchronous orbit.
- REQ-04 (Mission Lifetime): The mission shall provide at least five years of science operations, excluding commissioning and disposal phases.
- REQ-05 (Total Mission Cost): The total mission cost, including launch, shall not exceed 170 M€.
Science flow-down:
- SCI-01 (Atmospheric Influx): The mission shall contribute to investigating the amount and effects of the influx of anthropogenic material into Earth’s atmosphere.
- SCI-02 (Debris Monitoring): The mission shall understand sources and sinks of space debris and monitor its time- and location-variability.
- REQ-06 (Primary Payload Accommodation): The platform shall accommodate the TOF-MS impact ionization instrument (16 kg, 25 W, 500 × 600 × 800 mm, 45° FOV, 30 V, 150 krad TID).
- REQ-07 (Secondary Payload Accommodation): The platform shall accommodate the piezoelectric dust counter (4 kg, 4 W, 200 × 200 × 50 mm, 180° FOV, 28 V, 150 krad TID).
Operational envelope:
- OPS-01 (Mission Phases): The mission shall include Launch, Commissioning, Ascending Science, Descending Science, and Disposal phases.
- OPS-03 (Dusk–Dawn SSO): The operational orbit shall be a dusk–dawn Sun-synchronous orbit to guarantee permanent solar illumination of the arrays and to keep the TOF-MS aperture away from the solar vector.
- OPS-04 / OPS-05 (Continuous Science and Downlink Cadence): Science shall be continuous except during maneuvers; science and housekeeping shall be downlinked at least once per orbit with at least three orbits of on-board buffering.
- OPS-07 (Disposal): The spacecraft shall perform a compliant end-of-life disposal within 25 years, with a goal of 5 years.
¶ Concept of Operations and Mission Modes
The mission is organized into five phases over approximately 5.25 years, as summarized in Figure 1 and Table 2. Ascending and descending science share a single continuous low-thrust spiral; the payloads never stop acquiring except when thrust arcs would contaminate the measurement (REQ-33).
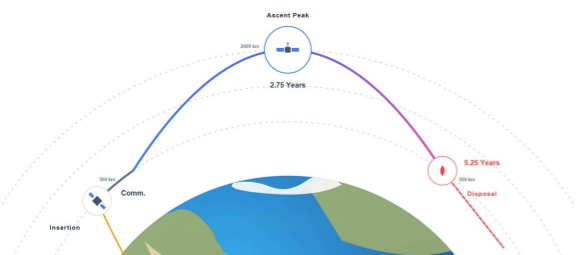
Figure 1 CONOPS — Altitude profile and mission phases for STARDUST (rideshare insertion at 500 km, ascent to 2000 km, descent, and disposal at 5.25 years).
| Phase | Altitude | Duration | Primary activity |
|---|---|---|---|
| Launch | 0 → 500 km SSO | Hours | Rideshare injection into dusk–dawn SSO |
| Commissioning | 500 km | ≤ 3 months | Deploy, checkout, first-light |
| Ascending Science | 500 → 2000 km | ~2.75 yr | Primary survey; continuous low-thrust raise |
| Descending Science | 2000 → 500 km | ~2.25 yr | Extended survey; low-thrust descent |
| Disposal | 500 → 300 km | ≤ 6 months | Propulsive descent, passivation, natural re-entry |
Table 1 Mission phases, altitude profile, and duration.
Five on-board modes cover the full life cycle: Activation (commissioning), Payload Acquisition (nominal science, ram-pointing with Sun/Earth avoidance), Downlink (S-band TT&C and X-band science), Autonomous Safe (Sun-pointing, ≥ 72 h without ground contact per REQ-44), and Passivation / End-of-Life.
¶ Risks and Mitigations
The mission risks were identified and categorized into three families. Environmental risks (ENV) cover external hazards inherent to the orbital environment. Hardware risks (HW) address failure modes internal to the spacecraft, the most critical being permanent blinding of the TOF-MS sensor. Project management risks (PM) capture programmatic uncertainties around cost and schedule.
Following mitigation, all risks are reduced to medium or low residual severity, with no high-severity risks remaining.
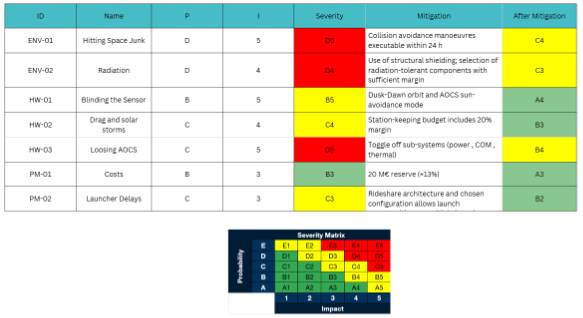
Figure 2 Risk Assessments Matrix
¶ Lessons learned
Acting as the Systems Engineer for STARDUST highlighted a handful of lessons that transcend the individual subsystems:
- Concurrent engineering only works with a single source of truth. The COMET option_1 sheet plus the weekly plenaries kept requirements and budgets consistent; values updated outside it always produced a divergence within one or two iterations.
- The ConOps had to be drawn before the subsystems could converge. The 180° flip between ascending and descending science, and the payload duty cycle during thrust arcs, only surfaced once the mission timeline was on paper. Subsystems that started before that diagram had to backtrack.
- Most of the work in this phase is translation: customer statement → top-level requirements → subsystem requirements. Getting that translation stable early is what stopped the subsystems chasing moving targets.
¶ Trajectory Analysis
¶ Requirements
The Trajectory Analysis section is responsible for the selection of the trajectory that most optimally suits the overall mission goals while still conforming to the requirements of all other subsystems. The specific requirements are thus as follows:
- REQ-TRAJ-01 (Initial Orbit): The initial orbit shall be circular with an apogee and perigee altitude between 450 and 550 km.
- REQ-TRAJ-02 (Inclination): The orbital inclination shall be within 0.1° of the Sun-Synchronous inclination for the specific altitude.
- REQ-TRAJ-03 (RAAN): The Right Ascension of the Ascending Node shall be within ±1 hour of 6:00 AM / 6:00 PM local time (dusk-dawn SSO).
- REQ-TRAJ-04 (Maximum Orbit Altitude): The orbit-raising phase shall target the maximum altitude achievable with the available delta-V budget while maintaining a viable deorbit capability.
- REQ-TRAJ-05 (Radiation Belt Avoidance): The orbit design shall minimize cumulative time spent in the inner Van Allen radiation belt (proton belt, ~1500–10000 km). Transit through the belt during orbit raising/lowering shall be as rapid as feasible.
- REQ-TRAJ-06 (Orbit Maintenance): At each science altitude, the spacecraft shall maintain the orbit within ±10 km of the target altitude for a minimum dwell time sufficient to collect statistically significant debris data.
- REQ-TRAJ-07 (Deorbit Compliance): The trajectory plan shall ensure the spacecraft can deorbit (re-enter or reach a disposal orbit) within 25 years of end-of-mission, with a goal of 5 years or less.
- REQ-TRAJ-08 (Delta-V Budget): A delta-V budget shall be established covering orbit insertion correction, orbit maintenance, orbit raising, orbit lowering, and deorbit, with at least 10% margin.
- REQ-TRAJ-09 (Collision Avoidance): The mission shall include a collision avoidance strategy using conjunction data from space surveillance networks and shall be capable of performing avoidance maneuvers within 24 hours of a confirmed high-risk conjunction.
¶ Tradeoffs and Justifications
¶ Main Assumptions
Assumptions were made to allow for refinement of overall mission goals and thus to start the process of selecting an orbit. The key assumptions were that this mission had a 5-year operational lifetime at minimum and that the dust and debris the mission seeks to explore orbit largely prograde over a range of inclinations.
¶ Main Design Drivers
Our key considerations when determining a suitable trajectory for this mission, as defined in the science goals of this mission, were first to maximise dust flux through the sensors and to analyse the time variance and location variance of this dust. After further discussion with the customer, we agreed to focus experimental time at altitudes less than 1000km, especially below 800km as these were prioritised, and ideally to explore dust in regions of space which were novel for dust exploration satellites. To meet all the drivers, it is imperative that the velocity of the spacecraft relative to the inbound dust and debris was maximised. The required thresholds are seen in Figure 3, with our goal to have a high probability of achieving relative velocities above 10m/s for more than half of every orbit, and to prioritise metal elements from the list of potentials, also described in Figure 3.
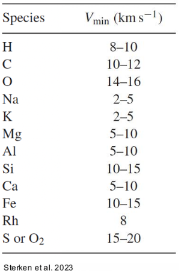
Figure 3 - Necessary relative velocities required for the spectrometer to achieve readings for dust of a given chemical makeup (taken from Customer Specifications).
¶ Trajectory Selection
Considering the science requirements, the internal requirements from each respective subsystem and the design drivers and assumptions, we established two possible trajectories for the mission.
¶ Retrograde Molniya Orbit
The first orbit proposed was a highly eccentric retrograde orbit, like the Molniya orbit first used by Russian Geoscientists as an alternative to GSOs. After launch and initial commissioning, we would inject, via kickstage or otherwise, into a highly elliptical orbit with a perigee altitude of approximately 400km, and an apogee of approximately 36000km. Over the course of the first half of the mission, the spacecraft would partially circularise the orbit to raise the perigee, until the perigee was 3000km after a mission elapsed time of 2.75 years. Following this, the spacecraft would then undo this partial circularisation and would reduce the perigee to 400km after a mission elapsed time of 5.25 years. The spacecraft would then enter an end-of-life phase and deorbit. A visualisation of the orbit can be seen in Figure 4.
Figure 4 shows a GMAT simulation of the first proposed orbit. We can observe that the spacecraft starts in a retrograde circular orbit, before transferring via a kickstage into a highly elliptical orbit with an apogee altitude of 36,000km. Then over 2.5 years, the perigee is raised to 2000km. It is noted that the many small transfer orbits between the initial orbit and the maximum orbit reached are not shown, so the plot does not become cluttered.
Advantages
- At perigee, due to the assumed largely prograde nature of atmospheric dust, the spectrometer would experience high relative velocities to any dust encountered.
- The high eccentricity of the orbit would allow for a large range of altitudes to be explored.
Disadvantages
- This orbit is highly expensive to achieve from a cost perspective due to the unusual trajectory and the need for a dedicated launcher.
- Expensive to achieve from a delta-v budget perspective as raising the perigee at such an eccentricity is an expensive maneuver.
- The eclipse time is very high and has extremely challenging implications to other spacecraft subsystems, notably power, thermal and CADH.
- At higher altitudes, the relative velocity to inbound dust is outside the required range for many elements.
- Time spent within the Van Allen Radiation belts is high.
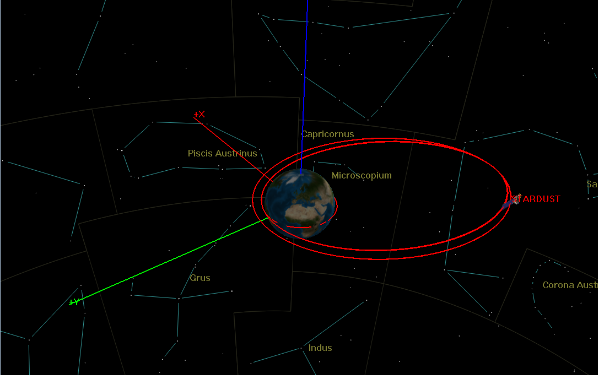
Figure 4 - Retrograde Molniya Orbit Simulation
¶ Circular Dawn-Dusk SSO
The second orbit proposed was a circular dusk-dawn SSO, again involving an element of orbit raising and degrading to achieve the mission goal of understanding the space and time variance of atmospheric dust. The trajectory starts at 400km and follows a spiral trajectory as the orbital altitude is raised slowly to 2000km after initial commissioning, performing inclination change maneuvers where required to maintain SSO. This maximum altitude is reached after a mission elapsed time of 2.75 years before the altitude is then decreased back to 400km for the remainder of the mission. Following this, an end-of-life stage is entered, and the spacecraft is set on a burn-up trajectory. A simulation of this trajectory can be seen in Figure 5 and 6.
Figures 5 and 6 show the simulated results of the second proposed trajectory, highlighting the spiral nature of the orbit. It is further noted that the orbits would change in much smaller increments during the real mission, but to more easily visualise the spiral effect larger steps between orbits were taken. Also, while difficult to observe, Figure 5 shows the inclination changes required as the orbit is raised to the maximum altitude. It is noted here that the yellow axis denoted ‘+S’ shows the direction of the Sun with respect to Earth.
Advantages
- Popular initial orbit allows for use of cheap rideshare launches.
- Dust observation satellites have spent less time in SSO and polar orbits.
- For every orbit, we spend more time at key altitudes as requested by the customer, and as specified in the main drivers.
- The nature and consistency of SSO simplifies operations and design for all other subsystems.
Disadvantages
- Large inclination change delta-v required to maintain SSO as altitudes are changed.
- Lower peak relative velocities resulting in dust formed from Oxygen and Dioxide being outside the expected relative velocity range for the mission.
- Less/No time spent in regions of higher altitudes.
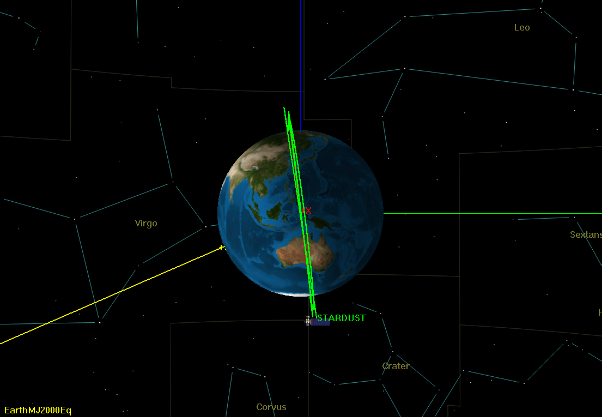
Figure 5 - GMAT Simulation of Circular Dawn-Dusk SSO Trajectory (View into X axis)
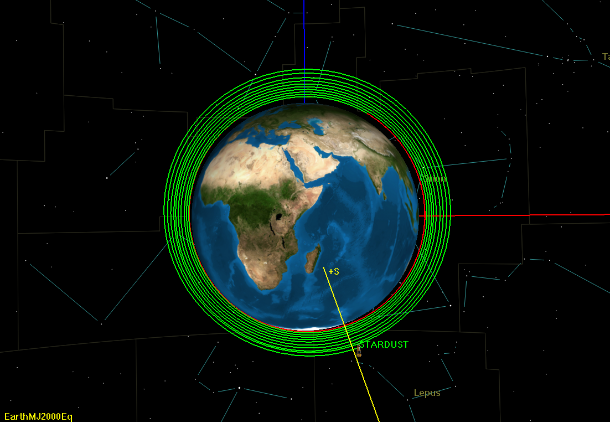
Figure 6 - GMAT Simulation of Circular Dawn-Dusk SSO Trajectory (View along Y axis)
¶ Results
¶ Final Orbit Selection
Based on the tradeoff outlined above, we selected the Circular Dusk-Dawn SSO. The orbit allows us to fulfill all of our objectives and should result in a significantly cheaper mission compared to the Molniya orbit. This is mostly due to the constant power provided by the sun and the limited eclipses in this type of SSO. Additionally, it is also easier and cheaper to reach by a launcher than the Molniya orbit.
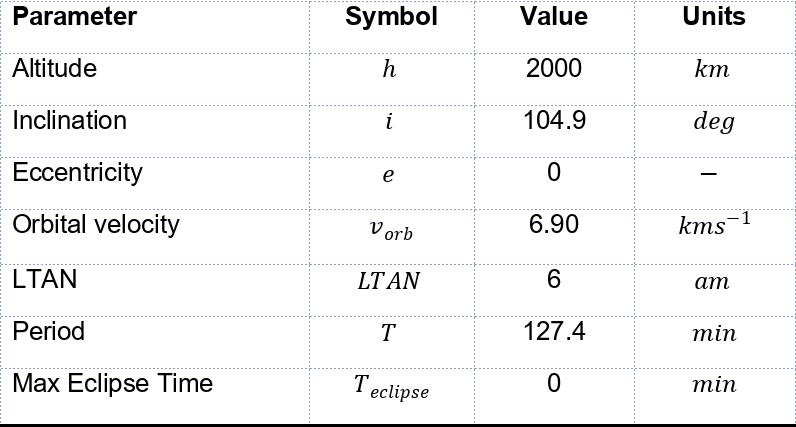
Orbital Parameters of Deployment Orbit
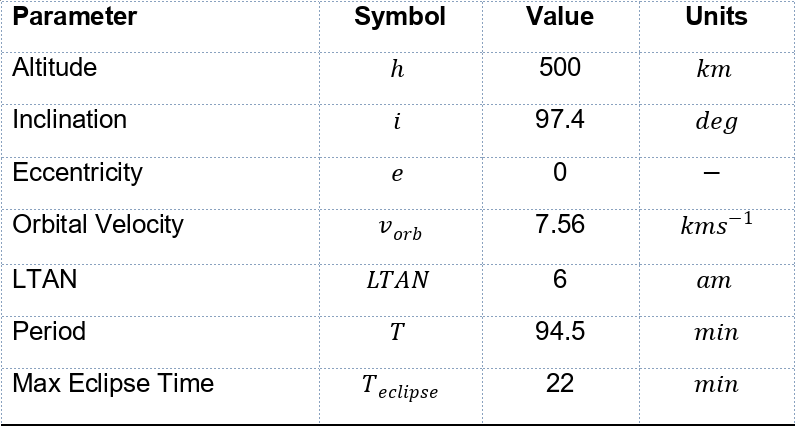
Orbital parameters of Highest Orbit
¶ Mission Stages
The spacecraft is deployed into a 500x500 km Dusk-Dawn SSO by the launcher. Throughout the mission we continuously raise our orbit until we reach a 2000x2000 km orbit. At this point we turn the spacecraft around and lower our orbit back to a 500x500 km orbit. Once an altitude of 500km is reached, we continue to lower our trajectory until we reach an altitude of 300 km and can safely burn up the satellite in the atmosphere. A detailed illustration of our CONOPS can be seen in Figure 1 within Section 3.1 of the System Engineering Section. The orbital parameters of our deployment and highest orbit can be seen in the tables in sections 3.1.1 and 3.1.2 respectively.
The mission is constructed in a way that allows us to collect scientific data at any given time. As you will see in Section 3.5, we achieve the required 10 km/s relative velocity to the average particle throughout every mission stage.
The selected orbit brings with it some challenges that need to be addressed. Firstly, we made the decision to stay in an SSO for the entire duration of the mission. Since the required inclination for an SSO changes with altitude, we also need to change our inclination while raising and lowering the orbit. We believe that the decreased eclipse frequency and duration in a Dusk-Dawn SSO contributes to large cost and complexity savings for the thermal and power subsystem. These projected cost savings would outweigh the projected increase in propellant needed to change the inclination.
Throughout the mission, we would therefore change the orientation of the satellite while crossing the equator to provide the necessary change in inclination. Once we have reached an altitude of 2000 km, we turn around the satellite and use our thruster to lower the orbit. This also necessitates a 180-degree rotation of our payload as it needs to be kept pointing in flight direction.
¶ Standard Orbital Calculations
The first calculations performed were a series of standard calculations for circular orbits to define required orbital parameters:
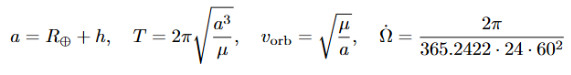
Where in the case of SSO, the required nodal progression is 360 degrees per year to match the rotation of the Earth.
¶ Delta-V
- Plane Change
Rearranging the nodal regression equation considering the nodal regression needed for SSO and the desired orbit altitude, we get the following expression for orbit inclination where all parameters have their standard meanings.
As we raise our altitude up to an altitude of 2000km from 400km, before reducing back down again, the total delta-v required to maintain SSO over the mission duration is defined below:
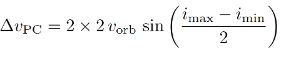
Where {Delta v_pc} defines the total delta-v required for all the plane change maneuvers during the mission.
- Altitude Change
The delta-v required to change the altitude of the orbit was approximated as a sequence of small Hohmann transfer steps between the minimum and maximum altitudes. For small altitude changes, this converges to the delta-v required for a continuous low-thrust spiral:
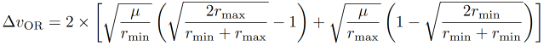
Where the above calculation includes both burns of the Hohmann transfer and {Delta v_or} defines the total delta-v budget for all altitude change burns during the mission. This equation was solved using a python simulation to sum over calculated Hohmann transfer for orbits with 1km steps.
- Station Keeping
The station keeping budget was derived from literature for spacecraft of our size, given the different orbits the spacecraft will spend time in. As can be seen in section 3.8, these final values were negligible with respect to the delta-v budget required for other maneuvers. Hence, these calculations need not be over scrutinized:
![]()
Where {Delta v_sk, altitude} defines the total delta-v required to maintain an orbit at a given altitude, and {t_altitude} defines the total time spent at a given altitude during the mission. Above 1000km, the station keeping budget becomes negligible for our mission.
¶ Eclipse
Knowing the worst-case eclipse duration is an important consideration in the design of thermal subsystem as well as for the sizing of the battery. Additionally, knowing the total amount of eclipses allows for further refinement of battery size. The calculation of these parameters is outlined below.
Eclipse duration
For calculating the worst-case duration of an eclipse throughout the mission we first need to know two parameters. The beta-angle denotes the angle between the orbital plane and the sun vector. A lower beta angle means that the expected eclipses are longer. Since we are in a Dusk-Dawn SSO, we know that the lowest beta angle throughout the mission happens during winter solstice. At that moment the axis of the earth is tilted away from the sun by 23.45 degrees. Additionally, the inclination of our lowest orbit of 96.66 degrees leads to the orbital plane being tilted to a further 6.66 degrees when compared to the earth’s axis. This is visualized in Figure 3.5.1 below.
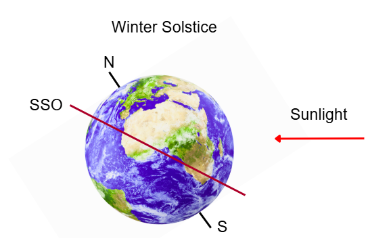
Figure 7: Worst-case scenario for eclipse duration
This leads to a total tilt of 30.11 degrees which when subtracted gives us a beta-angle of 59.89 degrees. The reason that we use the inclination of our lowest orbit is that for SSO’s the eclipses are longer the lower the altitude. This is symbolized by the second required parameter, the earth angular radius theta. It is calculated using the formula below, where R is the earth’s radius and a is the semi major axis of the orbit. The value of theta for an orbit with an altitude of 300 km, which is the lowest altitude encountered during the mission, is 72.75 degrees.
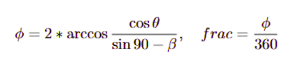
Using the values calculated above, we can calculate phi by using the formula below. Phi denotes the angular radius of the orbit that encounters an eclipse in degrees. By dividing it by 360 we get the fraction of the orbit spent in eclipse. Multiplying the fraction by the orbital period finally yields the eclipse duration. For our mission, the longest eclipse will have a length of 27 minutes.
Total number of Eclipses
To calculate the total number of eclipses throughout the entire mission, we used approximations. Further refinement would be needed to achieve a more accurate number. However, we are confident that our values end up in the correct ballpark.
By varying the beta angle and observing the eclipse duration with the formula above, we noticed that the minimal beta angle where eclipses would appear was 72.7 degrees at an altitude of 300 km.

In the above formula Γ denotes the ecliptic true solar longitude, Ω the RAAN, i the inclination and ε the obliquity of ecliptic of earth. By varying the RAAN and the ecliptic true solar longitude we were able to determine that the beta angle is below 72.7 degrees on 150 days around the winter solstice.
We also noticed that for any given beta angle, we would not have any eclipse above an altitude of 1000 km. We then proceeded by making simplifying assumptions. Namely we assumed that the transfer from 500 km to 1000 km as well as the lowering of the orbit from 1000 km to 300 km would take 2 years in total. Additionally, based on the calculations of the orbital period, we assumed that the average amount of orbits per day in those timespans would be fourteen. Therefore, solving 14 * 150 * 2 amounts to 4200 eclipses. Since we made quite some assumptions for this calculation, we included a big margin and rounded that up to a total of 5000 eclipses throughout the entire mission.
¶ Relative Velocity Calculations
Relative velocity was calculated with:
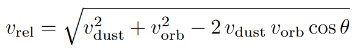
Where θ is the angle between the satellite velocity vector and the dust velocity vector, assuming a simple Earth-Centered Inertial (ECI) frame with a planar approximation for considering the average case. More explicitly, we consider:
¶ End of Life Strategy
Please refer to the sustainability section where the exact strategies are detailed.
The delta-v values for the end-of-life stage are outlined in section 3.8.2 and include the necessary delta-v to maintain SSO and to reduce altitude to the desired levels, in the desired timeframe, again as outlined in the sustainability section.
¶ Final Trajectory Results
¶ Orbital Parameters
Please see the tables in Section 3.1.1 and 3.1.2 for the orbital parameters of the initial and highest orbits.
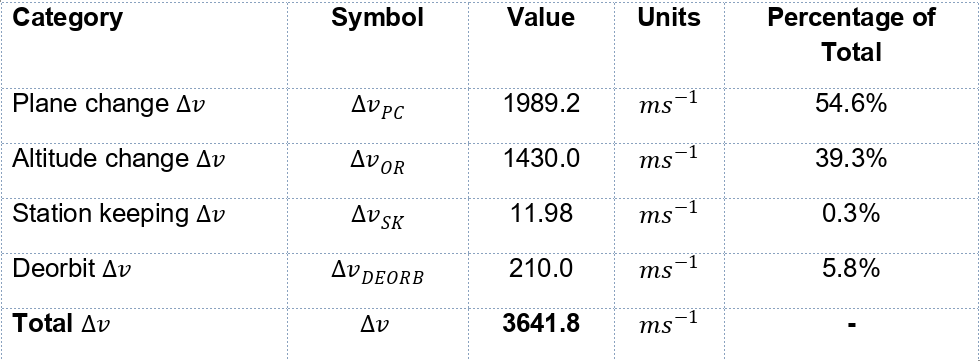
¶ Delta-V Results
¶ Warnings
¶ Assumptions
The assumptions made during trajectory selection were highlighted in section 2.1, and those made during calculations and simulations can be found in their respective sections.
¶ Known Problems
As seen in section 3.4, the delta-v calculations for orbit altitude raising and reduction and plane change maneuvers were done separately and then combined. We recognised that we could likely reduce our delta-v budget by combining these maneuvers. However, given the timeframe of this CDF and the implications that a large change to the total required delta-v could have on other subsystems, we opted to not further refine these calculations.
Another area which we are aware could have been investigated more rigorously was the relative velocity calculations. As seen in section 3.6, these were modeled assuming a simple ECI frame with a planar approximation, to reduce this to a 2D vector problem. We took the dust to be orbiting around the equator (i=0) to represent the average-worst case for the dust impact velocities with respect to the spacecraft. Simulating the spacecraft’s orbit with known current dust data would allow for better calculations in this case.
Furthermore, the station-keeping delta-v budget was derived from literature and given a 20% margin, and so could be refined given the final dimensions, mass and trajectory of the spacecraft. However, as seen in section 3.8.2, we note that the derived station keeping delta-v budget constitutes a minimal part of the total delta-v budget, and so improvements to this value are unlikely to make a significant difference.
¶ Potential Problems
The calculations for the burns required to raise altitudes were modelled as a series of very small Hohmann transfers, to achieve the spiral orbit and to allow for the use of low impulse, high ISP thrusters that could reduce the necessary propellant tank size onboard the spacecraft. While, from literature, we can assume that this approach is valid, we highlighted this as an area with potential improvement should there be maneuvers more suited to an orbit of this nature.
It’s also possible that our assumptions with regards to the orbit distribution of dust and debris are largely different than anticipated and thus a slightly different orbit would better suit a specific type of dust present in orbit around the Earth.
¶ Recommendations
We anticipate that the largest area of refinement would be improving the delta-v calculations. If every plane change maneuver was combined with every altitude increase/decrease maneuver, we expect that the total delta v required for the mission would reduce.
Similarly, carrying out more advanced simulations of the spacecraft to determine more accurate measurements for dust impact velocities would be beneficial to improve the trajectory selection of this mission. This could be done using full 3D velocity vectors in the Earth-Centered Inertial frame, accounting for orbital inclinations, eccentricities and a statistical distribution of approach angles through Monte Carlo simulations.
¶ Lessons Learned
There were many major learnings that we had throughout the engineering sessions.
The first one was the complexity of selecting the correct trajectory for the mission. Initially, we assumed that the trajectory design for an earth orbit mission would be quite simple compared to a lunar or interplanetary spacecraft. However, the nature of our science-driven trajectory with the additional constraint of sufficient relative velocities made our choice quite complex. Maximizing the scientific potential of the mission was an even bigger challenge than calculating all the required parameters for the selected mission profile. This is certainly not something that we expected and made us appreciate the challenges that come with balancing scientific interest and mission feasibility and cost even more.
Our second lesson learned concerns the concurrent engineering aspect of the course. Throughout all sessions, we functioned as drivers for mission objectives. We were the team that translated the scientific requirements into something tangible that could be built upon by the other subsystems. As such, communication becomes even more crucial for us than for other subsystems as our decisions have an impact on all the other teams. And while we generally did a good job keeping everyone up to date, it is incredibly clear with hindsight that we should have created a detailed concept of operations as early as possible. Crucially, we missed the impact that our decision to rotate the satellite at 2000 km would have on the spacecraft configuration and scientific instrument. This led to major problems towards the end of the design process, which luckily could be solved. With a clear diagram of the concept of operations, however, we believe that this issue could have been found a lot sooner. This would have led to a more efficient design and reduced risks. It shows that stopping the current task, zooming out and considering the system as a whole can save a lot of time in the long run.
Another lesson was with the use of Comet and Excel. We tried to use a shared excel document so both members of the trajectory team were working from the same version. However, we kept facing consistent problems with syncing and as a result ended up with a messy local sheet with lots of repeated calculations and constant definitions. It would have likely been more efficient to keep separate local excels and share our calculations via Comet to avoid the sync issues. In the end, we cleaned up 1 local version and completed the pull-update-push cycle from one computer, and this worked for the purposes of this study. Realizing a better solution to the sync issues earlier would have sped up iteration and thus the rate of improvement.
¶ Configuration
¶ Subsystems Requirements
The configuration subsystem is responsible for establishing the physical arrangement of all internal and external components used to build the spacecraft. The final configuration of our satellite was designed to satisfy the following requirements:
- REQ-CONF-01 (TOS-MS Field of View): The spacecraft configuration shall ensure the TOF-MS 45° FOV is unobstructed by any spacecraft element (solar arrays, antennas, thrusters) in its nominal pointing direction.
- REQ-CONF-02 (Dust Counter Field of View): The spacecraft configuration shall ensure the dust counter 180° FOV has maximum unobstructed exposure in the ram direction.
- REQ-CONF-03(Instrument Placement): The TOF-MS and dust counter shall be placed such that neither instrument is in the FOV shadow of the other.
- REQ-CONF-04 (Thruster Placement): Thrusters shall be positioned so that exhaust plumes do not impinge on instrument sensitive surfaces or apertures.
- REQ-CONF-05 (Rideshare Envelope): The spacecraft stowed configuration shall fit within the volumetric and mass envelope of the selected European rideshare launcher adapter.
- OPS-03 (Dusk–Dawn SSO): The operational orbit shall be a dusk–dawn Sun-synchronous orbit, which drives the orientation of solar panels and the thermal faces of the spacecraft.
- REQ-AOCS-001: Payloads must not point to the sun nor the earth albedo.
- REQ-AOCS-002: The payload shall point in the same direction as the spacecraft motion.
¶ Trade-offs and Justifications
¶ Overall Spacecraft Shape
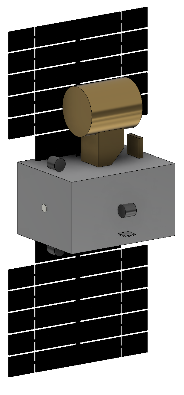
As discussed later in the Structures & Mechanisms section, the overall geometry was selected to be a rectangular prism. This choice was driven by the need for flat mounting surfaces for the instruments and subsystem components, optimal internal packing for the Xenon COPV tanks, and compatibility with the Ariane 62 rideshare fairing envelope. A cylindrical form was discarded as it would have complicated payload and internal component mounting and would have required active spacecraft rotation to keep the payload out of the sun vector.
The coordinate frame is defined as follows: the X axis points in the ram direction (velocity vector), the Z axis points toward Earth, and the +Y axis completes the right-hand frame.
From this geometry, the allocation of each face follows naturally from the mission constraints. The +Z face (top deck) hosts both science instruments, as it provides the stiffest and most thermally stable mounting surface and faces the ram direction when the spacecraft is in its nominal attitude. The −X face (rear side) is reserved for the main Hall Effect thruster. The ±Y lateral faces carry the antenna brackets at their lower edge, taking advantage of the permanent earth visibility guaranteed by the trajectory. The solar arrays, which could not be body-mounted on any face without interfering with instrument rotation or contaminating the science measurements, are deployed on an arm attached to the +X face (front side). This overall layout is the result of the successive trade-offs described in the sections below.
¶ Payload Placement
Two instrument placements were evaluated for the TOF-MS and the piezoelectric dust counter:
Option A – Instruments on separate faces:
Spreading the instruments across two faces avoids mutual obstruction but places the dust counter on the lateral side of the spacecraft, limiting its integration to the structural skin rather than the honeycomb deck.
Option B – Both instruments on the top deck:
Both instruments share the top deck (made in Al 2024-T3 honeycomb sandwich panel), which provides the stiffest, most thermally stable mounting surface on the spacecraft. The piezoelectric dust counter is placed at the front of the top deck, flush with the front edge, maximizing its forward sky exposure and fully satisfying its 180° FOV.
The TOF-MS is mounted centrally on the top deck, set further back. Because the TOF-MS body is significantly taller than the dust counter, its 45° aperture cone clears the dust counter entirely without any shadow obstruction, satisfying REQ-CONF-01 and REQ-CONF-03 simultaneously.
Option B was selected. Co-locating both instruments on the top deck also simplifies harness routing to the OBC and concentrates the payload thermal loads on a single well-characterized panel, reducing interface complexity with the thermal subsystem.
A critical operational consequence of this layout is the 180° spacecraft rotation required at the transition from Ascending to Descending Science. Because the TOF-MS must remain pointing in the direction of the spacecraft's motion, the entire spacecraft flips its thrust direction, and the instrument also rotates 180° to keep the same orientation.
¶ Thruster Placement
The main Hall Effect thruster is placed on the –X face. The thruster plume is thus expelled away from both instrument apertures, satisfying REQ-CONF-04. The 12 cold-gas desaturation thrusters (AOCS) are distributed symmetrically around the spacecraft perimeter, at the mid-height of each lateral face, to provide clean torque arms without plume impingement on the science apertures.
¶ Solar Panels Placement
Given the dusk–dawn SSO (OPS-03), the Sun illuminates the spacecraft nearly continuously from a direction approximately perpendicular to the velocity vector, making the lateral face the natural candidate for solar array mounting.
Initial design – lateral faces (+Y/−Y):
The first iteration placed the solar arrays mounted on the two lateral sides of the spacecraft. This is the conventional solution for dusk–dawn SSO and maximizes illuminated areas. However, two critical issues were identified during the design review:
- TOF-MS rotation interference: The 180° spacecraft flip maneuver performed at the ascending/descending science transition requires the TOF-MS to rotate also. Large panels mounted on the lateral faces interfered with the flip.
- Particle contamination: The outgassing and particle environment generated by the solar panels was flagged as a risk of introducing contaminants into the TOF-MS aperture during science operations, compromising measurement integrity.
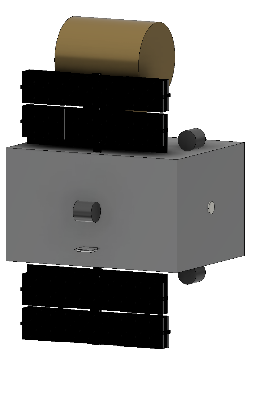
Revised design – arm-mounted on +X face:
Following feedback received at the design presentation, the solar arrays were relocated to an arm extending from the +X face of the spacecraft. Panels are mounted on both faces of the arm, providing power during both ascent and descent phases while keeping the arrays clear of the top deck instrument apertures. This configuration moves the panels away from the lateral rotation envelope, resolving the flip maneuver interference, and physically separates them from the science instruments, eliminating the contamination risk.
¶ Antenna Placement
Both the X-band payload downlink antenna and the S-band TT&C antenna are mounted on the bottom edge of the spacecraft lateral faces (+/- y faces), on a dedicated bracket structure. This positions both antennas permanently pointing toward Earth throughout the entire mission.
This placement is made possible by the trajectory design: the dusk–dawn SSO keeps the spacecraft above the Earth at all times, meaning a fixed earth-pointing antenna always has line of sight to a ground station without requiring any articulation or attitude-dependent pointing strategy. There is therefore no need to distribute the antennas across different faces to ensure coverage, as would be required in a more complex orbit.
This solution eliminates any risk of antenna shadowing by the solar arm or the spacecraft body during science operations and avoids the need for an omnidirectional antenna whose lower gain would reduce link margin.
¶ Avionics and Sensors Internal Layout
All avionics (OBC, PCDU, reaction wheel electronics, communication units, ...) are mounted on internal brackets attached directly to the Al 6061-T6 L-stringers, within the radiation-shielded volume provided by the spacecraft itself. This eliminates the need for individual shielding vaults on each component.
The Star Tracker is mounted on a dedicated rigid platform anchored to the internal stringers, isolated from the outer skin to avoid thermal-gradient-induced misalignment (REQ-SM-04). It faces a clear sky cone on the Y lateral face. The Sun sensor and Earth sensor are mounted on the top deck honeycomb panel. The GNSS module is placed on the +Z face.
¶ Results
¶ Final Layout
The final configuration places the main functional faces as follows :
| Face | Primary element |
|---|---|
| +X | Solar array arm |
| -X | Main HET thruster |
| +Y/-Y | Antennas |
| +Z | Payloads |
| -Z | Nothing |
¶ Center of Gravity
The center of gravity was extracted directly from the CAD assembly on Fusion 360 with the correct masses applied to each component. The CoG is located at :
| Axis | CoG Offset from A |
|---|---|
| X | +566.1 mm |
| Y | +622.5 mm |
| Z | -413.1 mm |
The point A is the point located at the –X,-Y,-Z intersection (rear bottom right edge)
The total assembly mass in the CAD model is (238.0 kg) is in excellent agreement with the Systems Engineering dry mass subtotal of 238.38 kg (266.62 kg after the 10% system-level margin), confirming the consistency between the CAD model and the mass budget.
¶ Moment of Inertia
The inertia tensor at the centre of mass was extracted from the same CAD assembly:
| Component | Value [kg * m3] |
|---|---|
| Ixx | 159.1 |
| Iyy | 139.4 |
| Izz | 48.2 |
| Ixy = Iyx | 0.1 |
| Ixz = Izx | -1.26 |
| Iyz = Izy | 1.35 |
The cross-product terms are small relative to the principal moments, confirming that the coordinate frame is close to the principal axis frame. The lowest moment of inertia is about the Z-axis (48.2 kg·m²), making rotation around this axis the least demanding and it’s useful for the 180° flip maneuver at the ascending/descending science phase transition. These values were provided to the AOCS subsystem for reaction wheel sizing validation.
¶ Rideshare Envelope Compliance
The launch vehicle selected is the Ariane 62, using the Multi Launch Service (MLS) MAS-H adapter. The MAS-H is a customizable platform accommodating 2 or more spacecraft side-by-side, with a total mass capacity of up to 5,000 kg and a platform diameter of up to Ø4300 mm (Ariane 6 MLS User's Manual, Issue 0 Revision 0).
Volume compliance: The spacecraft bus has a rectangular cross-section of 1224 × 924 mm (the structural height being 724 mm, oriented vertically along the launch axis). The circumscribed diagonal of this footprint is:
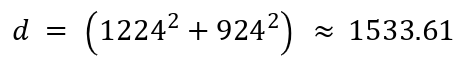 square root of the parenthesis.
In the 2-spacecraft MAS-H configuration (Fig. 3.1.1.d of the MLS manual), each spacecraft is allocated a cylindrical volume of Ø2130 mm, providing a margin of 597 mm over the 1533 mm diagonal. The spacecraft is therefore fully compliant with this envelope (REQ-CONF-05). The stowed height of the spacecraft is 1819 mm; per the MLS manual, the height of the allocated volume is not limited, so this is fully compliant.
¶ Lessons Learned
Working as the Configuration engineer in this concurrent design exercise highlighted several important lessons:
- Configuration is the permanent negotiator: Every subsystem has spatial needs that conflict with one another's. The purpose of this role is not to impose a layout, but to find the arrangement where the fewest requirements are compromised. This requires understanding every other subsystem's needs and components.
- The payload drives everything: The decision to place the TOF-MS and the dust counter on the top deck came early and locked most other choices downstream. Starting configuration work before payload accommodation is finalized leads to rearranging things permanently.
- Mass distribution is a system-level concern: The shift of CoG as the xenon is consumed throughout the mission has direct consequences for AOCS thruster sizing and propellant budget. Keeping the COPVs symmetric about the centerline was a deliberate configuration choice that reduced this risk at no mass cost.
- Document the face convention early and enforce it: Confusion between reference frames across subsystem teams caused multiple misunderstandings early in the CDF. Agreeing on a shared spacecraft frame (and affixing it to the COMET parameter sheet) from Day 1 would have avoided several interface errors.
¶ Structures & Mechanisms
¶ Subsystem requirements
The S&M subsystem is responsible for the integrity of the spacecraft from launch through end-of-life. The following requirements were derived from System Engineering requirements and Trajectory analysis:
- REQ-SM-01 (Structural Integrity): The structure shall withstand primary launch loads (quasi-static and dynamic) as defined by the launch vehicle user manual, maintaining a Factor of Safety (FoS) of at least 1.25.
- REQ-SM-02 (Mass Allocation): The total structural mass, including thermal control and secondary structures, shall not exceed the allocated limit of 172.2 kg.
- REQ-SM-03 (Radiation Shielding): The structure shall provide inherent shielding to mitigate the high-energy electron flux associated with the 2,000 km Circular MEO orbit.
- REQ-SM-04 (Pointing Stability): The side-mounted Star Tracker shall be isolated from thermal-elastic distortion to maintain arcsecond-level alignment with the payload.
- REQ-SM-05 (Passive Architecture): To reduce complexity and risk, the structure shall feature zero deployable mechanisms (fixed solar arrays and antennas).
¶ Trade-off and Justifications
¶ Geometry: Rectangular Prism vs. Cylindrical
A trade-off study was conducted between a cylindrical bus and a rectangular prism. While a cylinder offers superior mass-to-volume efficiency and was initially suggested to be used to rotate so the payload doesn’t face the sun, the Rectangular Prism (122.4×102.4×72.4 cm) was selected after eliminating the need for rotation of the whole spacecraft. This choice was driven by the configuration of the launch vehicle envelope and the need for flat mounting surfaces for the fixed solar arrays. The prism geometry also allowed for superior packing efficiency for the Xenon tank and the TOF-MS payload.
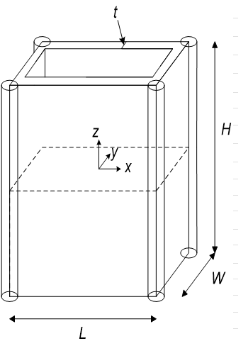
Figure 8 Simplified view of the spacecraft geometry, with the 4 corner stringers.
¶ Material Selection and Radiation Strategy
A "Battleship" structural strategy was adopted to solve the harsh radiation environment of the Circular Dusk-Dawn SSO.
- Skin (Aluminum 7075-T6): Instead of a thin-walled shell requiring complex internal spot-shielding, a 1.2 cm thick skin was selected. This provides a monolithic radiation vault (Z=13) that stops primary electrons without generating significant secondary Bremsstrahlung radiation.
- Internal Frame (Aluminum 6061-T6): To support the 100.3 kg skin, an internal L-stringer skeleton was implemented. Al 6061-T6 was chosen for its superior extrudability and machinability, significantly reducing manufacturing NRE (Non-Recurring Engineering).
- Top Deck (Al 2024-T3 Honeycomb): The top deck supports the primary TOF-MS payload. A honeycomb sandwich panel was justified here to maximize the area moment of inertia, preventing the deck from bowing or vibrating excessively during launch.
¶ Component Integration
To save mass, a direct-mounting strategy was used for the Earth, Sun, and GNSS sensors on the honeycomb top deck using potted inserts. However, for the Star Tracker, a dedicated rigid platform was justified. This platform anchors directly to the internal 6061-T6 stringers via space grade brackets, bypassing the 1.2 cm skin to ensure that thermal gradients in the Dusk-Dawn orbit do not misalign the optical axis.
¶ Results
The final design achieves a high degree of robustness while remaining well within the mass ceiling. By shifting the load-bearing requirements to the internal frame, the subsystem was able to accommodate the heavy shielding skin without breaking the mass budget.
Following the guidelines set by the Ariane 6 User’s Manual (Issue 2 Revision 0), the primary structure is designed to survive the most demanding flight phases. For an Ariane 62 launch, the mission must withstand a maximal compressive load of 3.1 g (occurring during ESR jettisoning) and a maximum traction stress of approximately 6.0 g (at ESR End of Flight).
The structural design utilizes a "Battleship" philosophy, leveraging a robust, thick-walled aluminum shell to serve as both the primary load path and a monolithic radiation shield for the 2,000 km SSO environment.
¶ Load Analysis and Internal Skeleton
The primary axial loads are handled by four internal L-shaped stringers manufactured from Aluminum 6061-T6. This alloy was selected for its high strength-to-weight ratio and superior extrudability. By anchoring the structure to these stringers, the outer skin acts as a shear panel, preventing global buckling.
The critical buckling load (Pcrit) for these slender columns was verified using the Euler buckling formula:
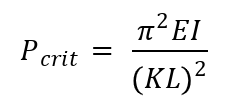
Using a Young’s modulus (E) of 68.9 GPa and a total cross-sectional area of 276 cm² for the four-stringer assembly, the frame provides a safety factor well above the required 1.5, ensuring stability under the 156.14 kg maximum launch mass.
¶ Structural Skin and Radiation Hardening
A significant design choice was the implementation of a 1.2 cm thick structural skin (t=1.2 cm) using Aluminum 7075-T6. This high-strength alloy (Yield=503 MPa) was chosen not only for its mechanical properties but also for its medium atomic number (Z=13), which effectively stops high-energy electrons without generating excessive secondary Bremsstrahlung radiation.
To verify the shielding effectiveness, the mission utilized the Vanderbilt University R-GENTIC tool to simulate the Total Ionizing Dose (TID) against varying thicknesses of Aluminum shielding.
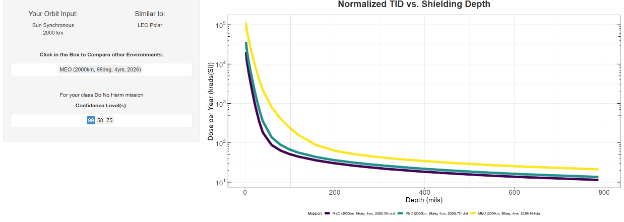
Figure 9 Verification of thickness sufficient against radiation.
As shown in the simulation results (Figure 9), the radiation dose follows an exponential decay relative to shielding thickness. The analysis highlights a critical "knee" in the curve between 10 mm and 12 mm.
- At thicknesses below 10 mm, internal components are subjected to high levels of trapped electron and proton flux.
- At the selected 12 mm (1.2 cm) threshold, the TID is mitigated to a level where standard Space-Grade COTS electronics can operate reliably over the mission’s lifetime.
By choosing this "Battleship" thickness, the structural skin mass (100.27 kg) effectively replaces the need for heavy, localized Tantalum or Tungsten vaults. This provides uniform radiation "safe-zone" for all internal payloads, including the Xenon tank and TOF-MS, while ensuring that secondary Bremsstrahlung radiation generation is kept to a minimum.
¶ Thermal and Deck Optimization
To withstand the permanent thermal gradients of the Dusk-Dawn SSO, a 40-layer space-grade MLI coating was applied. The top deck, which supports the TOF-MS payload, utilizes an Aluminum 2024-T3 Honeycomb sandwich panel. This maximizes the area moment of inertia to prevent bowing under payload weight while maintaining a low mass of 5.09 kg.
¶ Final Mass Budget Summary
The total structural mass was calculated with a 20% margin to account for fasteners, potted inserts, and manufacturing tolerances.
| Component | Material | Mass [kg] |
|---|---|---|
| Skin Structure (1.2 cm thickness) | Aluminum 7075-T6 | 100.27 |
| Internal L-Stringers (x4) | Aluminum 6061-T6 | 14.904 |
| Top Deck (Honeycomb) | Al 2024-T3 | 5.089 |
| Bottom Deck | Aluminum 7075-T6 | 3.814 |
| Subsystem Platforms | Al 6061-T6 | 0.951 |
| Thermal Coatings (40-Layer MLI) | Space-Grade | 5.09 |
| Total Base Mass | 130.118 | |
| Final Mass (+20% Margin) | 156.141 |
Table 1 Structural mass per material and spacecraft subsystem
The resulting launch mass of 156.14 kg is well within the 172.2 kg system allocation, leaving a contingency of 16.06 kg for future design maturation.
¶ Lessons Learned
Throughout the preliminary design phase as the Structures and Mechanisms Engineer I identified several technical and process-oriented lessons:
- Integrated Shielding philosophy: Initially, we reviewed structural mass solely as a penalty to be minimized. However, by adopting the Battleship strategy and utilizing the 1.2cm Aluminum 7075-T6 skin, we learned that the mass can be used as a strategic resource. By accepting a heavier structure, we managed to eliminate the need for more complex anti-radiation solutions, thereby reducing the risk and Non-Recurring Engineering (NRE) costs for all other electronic subsystems.
- Geometry vs. Volume Efficiency: The pivot from cylindrical to rectangular prism structure showed us that volume efficiency is often more critical than mass efficiency. The rectangular form factor not only accommodated the Xenon tank better but also drastically simplified the mounting of fixed solar arrays, validating the choice of simple more manufacturable geometry.
- Interdisciplinary Communication and System Coupling: One of the most vital non-technical lessons was the absolute necessity of continuous communication between subsystem teams. Spacecraft design is highly coupled, meaning a single design choice in one subsystem triggers a chain reaction across all other subsystems. As an example, the structural thickness directly impacted the mass budget for System Engineering, the thermal inertia of the spacecraft for Thermal control and the internal volume available for the Xenon tank for Propulsion. With this, we learned that regularly updating other disciplines on our decisions is critical to prevent design flaws and to ensure seamless integration at system level.
- Lastly, this course gave me an opportunity to actually apply knowledge and act as an engineer in a team, highlighting both my strengths and weaknesses and where I need to improve to become a better team member and engineer before entering the workforce.
¶ Propulsion
¶ Requirements
The primary purpose of the propulsion subsystem is to provide the controlled thrust necessary to alter and maintain the vehicle’s orbital trajectory. The subsystem's specific architecture and operational capabilities were driven by the following core requirements:
- REQ-PR-01 (Total {Delta v} Capability): The propulsion system shall provide sufficient total delta-V to perform orbit raising from ~500 km to the maximum target altitude, orbit lowering, deorbit, and orbit maintenance over the 5-year mission.
- REQ-PR-02 (Propulsion Contamination): Thruster exhaust shall not contaminate the sensitive surfaces of the TOF-MS or dust counter instruments.
- REQ-PR-03 (Propellant Budget Margin): The propellant mass budget shall include at least 10% margin beyond the nominal delta-V budget.
- REQ-PR-04 (Propellant Passivation): All components and propellants shall degrade during re-entry at minimum risk.
- REQ-PR-05 (Propulsion Power Draw): The propulsion system shall draw less than 300W (peak).
¶ Trade-offs and justifications
As established earlier in this report, the selected mission profile imposes an exceptionally high {Delta v} within a medium-duration lifecycle.
Operating as a primary payload subjects the spacecraft to volumetric and wet-mass limitations. Furthermore, the propulsion architecture must satisfy strict safety protocols regarding propellant toxicity, prevent physical contamination of the scientific payloads, and operate within a tightly coupled electrical power budget.
To reconcile these competing demands a series of trade-off analyses were conducted. The following sections detail the reasoning behind the final system architecture, evaluating the propulsion technology, power balancing, and hardware redundancy.
¶ Technology: Chemical vs Electrical
- High {Delta v} and Fuel Volume: Chemical systems provide high thrust but suffer from low specific impulse ({I_sp} in the hundreds of seconds). Fulfilling a 3.6 km/s {Delta v} budget would require an infeasible amount of propellant and massive tanks that would physically violate volumetric and mass limits of the launcher. By utilizing highly efficient electric propulsion ({I_sp} in the thousands of seconds), the total required propellant drops to feasible levels.
- Medium mission duration: While electric propulsion produces low thrust (from sub mN to tens of mN), extending maneuver times by an order of magnitude, the medium duration mission lifecycle easily absorbs this. Being inserted directly at the starting altitude (500km) by the launcher removes the need for an impulsive, high thrust maneuver, more fitted to a chemical system.
- Toxicity and Handling Costs: Most chemical propellants are highly toxic, carcinogenic and hypergolic. Using them requires specialized hazmat refueling operations and dedicated bunkers for testing. Furthermore, launch providers often set regulations on hazardous payloads. Electric propulsion uses inert/noble solids or gases that allow for normal cleanroom integration, cutting back on complexity and costs.
- Sustainability & Payload Data Contamination: Chemical combustion exhausts unburned fuel, by-products and water-vapor which on top of polluting space could impact the payload’s measurements. However, green propellants could reduce this issue. An electrical thruster expels a clean, ionized plasma beam, virtually eliminating contamination risks if combined with careful positioning.
Considering this analysis, it was decided to move forward with the Electrical propulsion technology.
¶ Electrical Propulsion Topologies
- Electrospray & Micro Ion: These systems offer ultra lightweight, tankless architectures utilizing solid iodine or liquid metals. The thrust level is typically low (~1mN), and analysis revealed that the mission duration would exceed the allotted 5 years.
- Gridded Ion: These systems offer high {I_sp} (>3000s), which greatly minimizes fuel mass. However, they suffer from low thrust to power ratios and the physical acceleration grids are highly susceptible to plasma erosion during the prolonged, continuous burns required by the flight profile.
- Hall Effect: These offer the middle ground (thrust in the 1-30mN and {I_sp} ~1000s). Furthermore, their magnetic grid is virtually immune to erosion (the hollow cathode is more susceptible to cycling) making it ideal for prolonged firing. They have been widely used since the 60s and many designs are flight proven.
The Hall effect thruster was selected but there remained the question of the optimal propellant type. Most thrusters can function with Xenon, Argon and Krypton.
- Argon/Krypton: While cheaper, Argon and Krypton are lighter gazes with lower ionization potentials: they require more electrical power to ionize and produce less thrust per watt. Moreover, they are less dense, increasing the dimensions of the COPV.
- Xenon: Xenon is a heavy, noble gaz. It is inert, non-toxic, and can be stored as a supercritical fluid under high pressure. It is a sustainable choice as most of its environmental impact is associated with production energy costs and it can be recovered and reused (especially useful during test campaigns).
With that, the final configuration is a Xenon Hall Effect thruster-based system.
¶ Redundancy vs Mass and Volume
Usually, mission assurance is achieved through hardware redundancy. For this system, this would mean doubling each critical component. While the thruster itself is compact and light, the rest of the system is not. Complexifying and enlarging the whole system for the sake of redundancy did not feel adequate. Instead, it was decided to use a “single-string” architecture.
To mitigate the risk of lacking physical redundancy, the system will use exclusively Technology Readiness Level (TRL) 9 components. By using flight proven components, the statistical probability of hardware faults is minimized.
The financial and mass savings achieved by omitting hardware redundancy can be reallocated into other mission phases (assembly, integration and testing). Furthermore, rigorous test campaigns can ensure absolute reliability prior to launch.
¶ Performance vs Power Draw
As soon as the Hall Effect thruster technology was selected, a separate analysis had to start. Indeed, thanks to their PPU (Power Processing Unit) and PFC (Propellant Flow Controller), these thrusters are throttleable. An example of such performance ranges can be seen below in Figure 10.
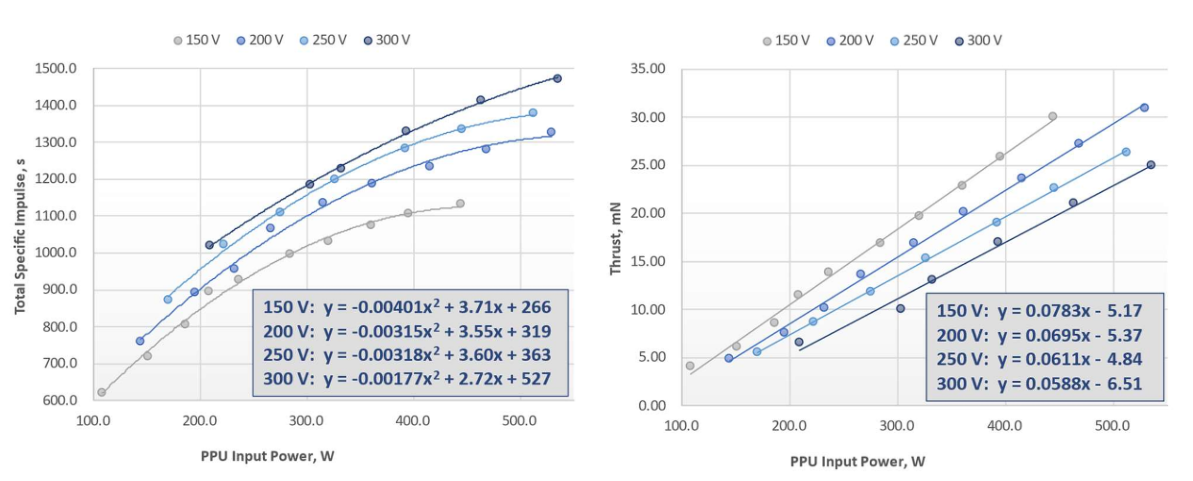
Figure 10: ExoTerra Halo (Xenon) Performance Graphs
The analysis looked at power draw, mission time and propellant mass in parallel. An optimization problem was solved to balance the PPU input power dictating the performance of the thruster while meeting the mission duration and propellant mass constraints.
¶ Results
The system was designed around the trade-offs and mission parameters described previously. Commercial off-the-shelf parts (COTS) were preferred, and most components are part of the same (ExoTerra Halo) system to ensure compatibility and performance. Said components include the thruster and propellant and power controllers (PPU, PFC, PMA). The final component to size is the tank to hold the propellant. As described when Xenon was chosen in 2.2., it is beneficial to store it under huge pressure conditions (~150bar). To do this, we use custom built COPVs (Composite Overwrapped Pressure Vessels) that have the added benefit of degrading well during reentry. It is here that the bulk of the iterations took place. The following computations happened in parallel until a satisfactory solution was found.
¶ Propellant Mass and Volume
Now is a good time to point out that in the proposed design, the propellant is shared between Propulsion and AOCS. It was decided that the cold gas thrusters would use Xenon as well to reduce the overall complexity of the system.
With this in mind, we start with the Tsiolkovsky rocket equation to find the propellant mass needed for our {Delta v}, total vehicle dry mass and chosen thruster performance values (see 3.4.).
![]()
The 17% margin was settled on at the end of the iteration process, once the tank volume was set.
Xenon being a non-perfect gas, the Wan der Waals equation was used to find the volume from the mass (we assumed 150bar of pressure and ambient temperature).
As it became clear that the propellant volume was converging towards 80L, the propellant margin reduced from an initial 20% to a more precise 17%.
The 80L value was key because COPV manufacturers generally sell 40/60/90/120L variants of their products. This means that to minimize the volume taken up by the tank while allowing for the 17% margin, a combination of two MT-Aerospace 40L Xenon COPVs was chosen.
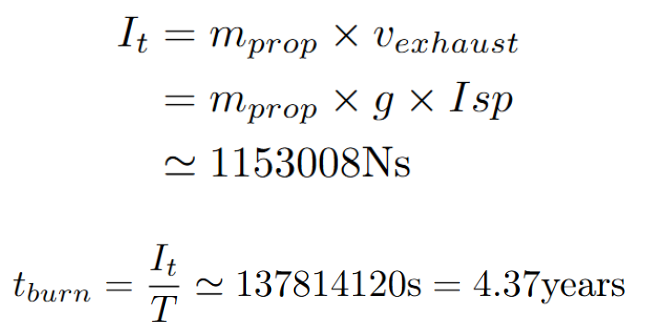
¶ Burn Time
The total thrusting time, driven by thruster performance (see Section 3.4) and propellant mass, was calculated to verify mission feasibility. Because the spacecraft has a strict 5-year lifespan, a transfer time exceeding this limit would mean the satellite degrades before it can fulfill its actual mission.
¶ Propellant Cost
Preliminary research on the cost of 126kg of aerospace grade Xenon yielded a price per kg varying from 2100$ to 4800.
¶ Power Budget
As explained in 2.4., the power budget is in direct link with the thruster performance in an electric propulsion system.
The optimal performance was found for a PPU input power of 253W yielding an {I_sp} of 1101s and a thrust of 8.3mN.
Adding other power draws from the PFC and PMA, the final peak power draw of 265W was found.
¶ Architecture
- 1 ExoTerra Halo thruster (TRL 9)
- 1 ExoTerra PPU (Power Processing Unit)
- 1 ExoTerra PFC (Propellant Flow Controller)
- 1 ExoTerra PMA (Pressure Manifold Assembly)
- 2 MT-Aerospace 40L Xenon COPVs
- Plumbing
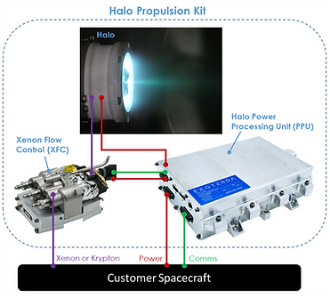
Figure 11: Overview of the ExoTerra Halo Propulsion System
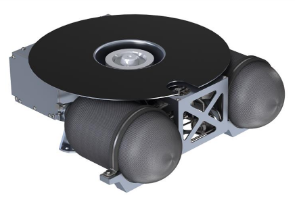
Figure 12: Conceptual Render of the Assembled Propulsion System
¶ Overall Dry Mass Budget
The total dry mass of the propulsion system is seen in the table below.
| Component | Mass (kg) |
|---|---|
| 1 ExoTerra Halo thruster | 0.85 |
| 1 ExoTerra PPU | 2.38 |
| 1 ExoTerra PFC/PMA | 1.3 |
| 2 MT-Aerospace 40L Xenon COPVs | 12.6 |
| Plumbing | 2 |
| Total (+5% margin) | 20.1 |
Table 2: Overall Propulsion System Dry Mass
¶ Lessons Learned
Throughout this preliminary design phase as the Propulsion engineer, I got to learn all about the technologies and components that make up a space propulsion system. I went in with no prior experience and got the chance to deep dive into technologies, systems, industry standards, and more. I now feel much more comfortable talking about the theory behind propulsion systems and their sizing. However, this is not the only thing I learned during this preliminary design phase:
- Comet: I found Comet to be an extremely useful piece of software with a dated UI. On top of serving as an overview tool, allowing users to keep track of the development of each system, and as a way to exchange data, it acts as a great single source of truth. This is vital in a CDF and makes iteration possible.
- Engineering:
- I got to witness firsthand how every interface between subsystems is a two-way street. For example, I absolutely depended on Trajectory’s {Delta v} value to size my system, but I had the duty to set limits: radiation weakness of the PPU meant that the satellite could spend less time in the radiation belts or increase its shielding. Another example is how initially, the dry mass target was given by the System Engineer but near the end of the design phase, I was the one that set that limit.
- Each modification has project wide consequences, and it is difficult to anticipate them at the beginning. As interactions between systems become clearer, so does your understanding of the impact of your changes.
- System Engineering Mindset: Architecting a satellite on paper requires a fundamentally different approach than physically building hardware, as I have done on the Rocket Team. However, I found profound satisfaction in the process itself: communicating across sub-systems, negotiating, and ultimately architecting a coherent and viable spacecraft from the ground up.
¶ AOCS
¶ Requirements:
- REQ-AOCS-001: Payloads must not point to the Sun nor the earth albedo.
- REQ-AOCS-002: The payload shall point in the same direction as the spacecraft motion.
- REQ-AOCS-003: The AOCS mass shall be within the mass budget assigned.
- REQ-AOCS-004: Actuators and sensors shall be selected to perform the attitude maneuver required.
¶ Trade-offs and justifications
The selection of AOCS components was driven by a balance between performance, reliability, system complexity, and resource constraints (mass, power, and volume).
¶ Attitude control
Reaction wheels were chosen as the primary actuators due to their high pointing accuracy and continuous control capability, which is essential for maintaining payload alignment with the spacecraft velocity vector (REQ-AOCS-002). A four-wheel configuration (three orthogonal + one skewed) was selected to provide redundancy and fault tolerance. This increases mass compared to a three-wheel system but significantly improves reliability and mission robustness.
¶ Reaction wheel desaturation
Cold gas thrusters were selected for reaction wheel desaturation because they provide reliable torque generation independent of the surrounding magnetic environment. Magnetorquers were considered as an alternative; however, their performance depends on the strength of the Earth’s magnetic field, which decreases with altitude and limits available control torque. Therefore, it was not suitable for our mission, which uses a Dawn–Dusk Sun-Synchronous Orbit (SSO). Since the spacecraft requires predictable and effective momentum unloading throughout the mission, cold gas thrusters were considered the more robust solution.
A set of 12 thrusters was selected to enable torque generation about all rotational axes and to ensure sufficient control authority during desaturation maneuvers. Although the use of thrusters introduces additional propellant mass, this approach offers higher maneuver reliability and shorter unloading times compared with magnetic control methods. Xenon was selected as the propellant because it can share storage infrastructure with the main propulsion system, reducing subsystem complexity, minimizing additional tankage requirements, and simplifying integration.
¶ Sensors
For attitude determination, a combination of sensors was selected to balance accuracy and resource usage. The star tracker provides high-precision attitude knowledge, while Sun and Earth sensors ensure compliance with avoidance requirements (REQ-AOCS-001). The GNSS module supports orbit determination, which is necessary for both navigation and sustainability requirements. However, only single units of each sensor were included, which reduces mass and power consumption but limits redundancy. This represents a trade-off between system robustness and resource constraints.
¶ Results:
¶ Selected component and mass/power budget
The final choice of sensors and actuators is presented in the table below, as well as the mass and power consumption of each component without margin. Margins of 5% were applied to most components to account for uncertainties, while a higher margin of 20% was used for the thrusters due to their lower technology readiness level. This reflects a conservative design approach to mitigate development risks.
| component | quantity | Mass [kg] (per unit / total) | Mean Power [W] (per unit / total) | Peak Power [W] (per unit / total) |
|---|---|---|---|---|
| RW | 4 | 1.0 / 4.0 | 3.0 / 12.0 | 15.6 / 62.4 |
| thruster | 12 | 0.18 / 2.16 | 2.0 / 24.0 | 2.0 / 24.0 |
| sun sensor | 1 | 0.037 | 0.015 | 0.15 |
| earth sensor | 1 | 0.4 | 4 | 4 |
| star tracker | 1 | 1.35 | 6,30 | 9 |
| GNSS module | 1 | 0.188 | 0.6 | 1 |
| total | - | 8.2 | 24.1 | 80.4 |
Table: mass and power of sensors and actuators (without margin)
¶ Attitude maneuvers:
There will be three types of maneuvers during operation:
- Aligning the payload to the direction to which the spacecraft is moving for measurement.
- Switching the direction of the main thruster by rotating 180 degrees after 2.75 years (Switching to ‘Descending Science’ phase, see Table 1 in ‘Systems Engineering’).
- Each time the S/C crosses the equator, the attitude is changed to adjust the inclination and maintain the trajectory.
The time it takes to rotate the satellite around one of the axes, which is the most difficult case, is shown in Figure below. For example, to rotate 60 degrees will take around 180 seconds to do so. This is largely sufficient since the desired angular velocity during operation is approximately 4 degrees per minute.
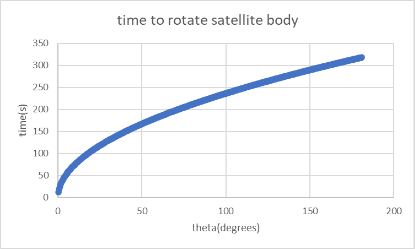
Figure 13: The time it takes to rotate the satellite body
3.3. Sizing of reaction wheel:
The sizing was done based on the maximum disturbance torque that the S/C might experience during operation. The calculations are as follows:
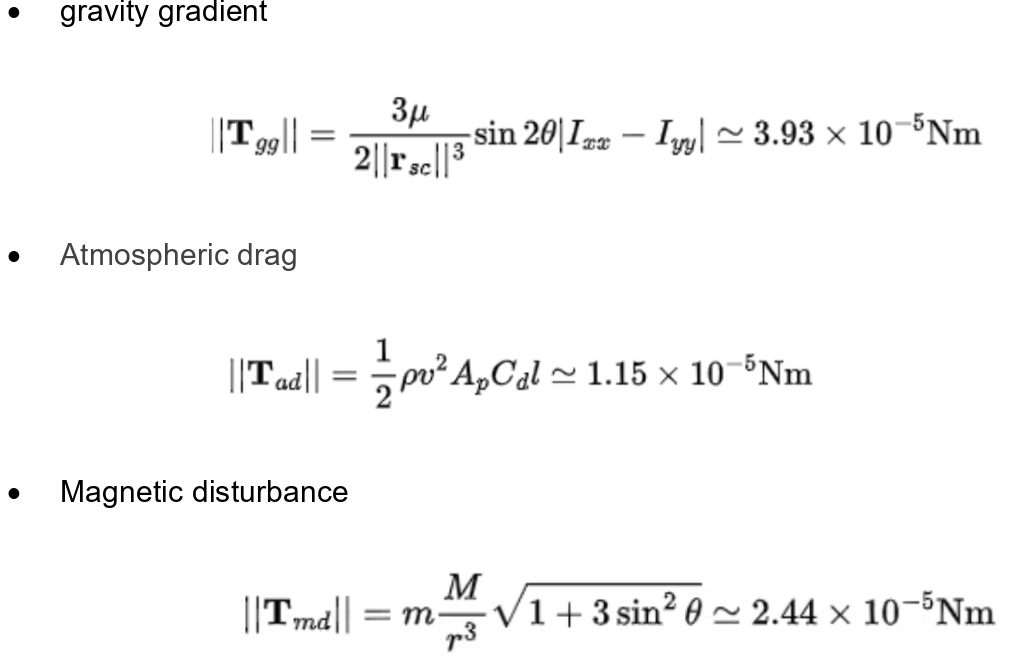
- Solar disturbance torque: Ignored since the S/C is almost symmetrical when seen from the sun.
Based on the calculations above, the maximum disturbance torque is 7.5 10-5[Nm].
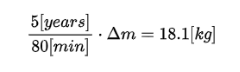
¶ Propellant mass for wheel desaturation:
Assuming that the maximum torque is constantly being applied, the following can be calculated:
-
Propellant mass needed to desaturate one reaction wheel
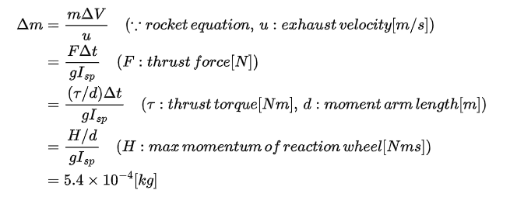
-
The minimum time for one reaction wheel to saturate if the disturbance torque was applied to only one of the reaction wheels, the time it takes to saturate it is:
- Total propellant mass for desaturation considering the values calculated previously, the propellant mass needed to desaturate the wheels during the mission duration can be calculated as follows:
¶ Lessons learned:
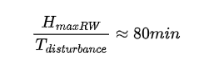
One of the key lessons I learned from this CDF was that all parameters should be quantified at the very beginning of the design process. I initially focused on deciding which components to use, without clearly defining the criteria for selecting them, and this ambiguity remained throughout the project. In addition, because I did not sufficiently quantify the design requirements, some choices—such as the wheel sizing—were not fully optimized, resulting in issues such as overly frequent desaturation intervals and unused mass allocation assigned by the systems engineer.
For AOCS specifically, I may not have included enough sensors. In previous CDFs, redundancy was achieved by using multiple sensors, but in my design, there was only one of each sensor. Although there was not enough time during this CDF to fully study controllability and related factors, I should have looked more carefully at past designs and applied those lessons to my own design.
¶ CDHS
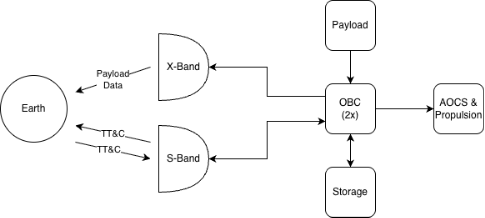
¶ Requirements
The Command and Data Handling (C&DH) subsystem is driven by scientific data volume constraints and operational safety needs. The subsystem must fulfill the following mandatory requirements:
Data Management & Downlink:
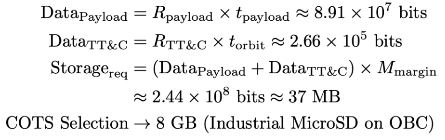
- REQ-CDHS-1 (Data Storage Capacity): The on-board data handling system shall provide sufficient memory to store at least 3 orbits worth of science and housekeeping data. This includes approximately 400 MBytes for the TOF-MS instrument and 3 MBytes for the dust counter and housekeeping, specifically designed to cover extended ground station gaps.
- REQ-CDHS-2 (Data Downlink Rate): The communication system shall support a downlink data rate capable of fully transmitting one complete orbit of science and housekeeping data within the duration of a single available ground contact window.
Payload Interfaces:
- REQ-CDHS-3 (TOF-MS Data Interface): The C&DH shall feature a dedicated data interface for the TOF-MS instrument capable of handling a peak volume of up to 125 MByte/day. This is sized for 1000 events/day at 200 kbit/event, including a safety factor of 5.
- REQ-CDHS-4 (Dust Counter Data Interface): The C&DH shall provide a secondary data interface dedicated to the dust counter, capable of handling up to 1 MByte/day.
Operational & Safety Functions:
- REQ-CDHS-5 (On-Board Time Accuracy): The on-board clock shall maintain a time accuracy of ≤1 ms relative to UTC. This is critical to support accurate timestamping of high-velocity impact events and precise orbit reconstruction.
- REQ-CDHS-6 (Autonomous Safe Mode): The C&DH system shall continuously monitor spacecraft health, detect anomalous conditions, and autonomously transition the vehicle to a safe mode. This mode must ensure spacecraft survival for a minimum of 72 hours without any ground intervention.
- REQ-CDHS-7 (Command Uplink): The subsystem shall successfully receive and process telecommand uplinks from the ground station to allow for instrument configuration, maneuver execution, and in-flight software updates.
¶ Trade-off and Justifications
To meet the requirements within the strict mass and power constraints of a small satellite, several architectural trade-offs were conducted:
¶ Number of Antennas (Single vs. Dual Architecture)
Options: Using a single antenna for all communications vs. splitting the architecture into two dedicated antennas.
- Justification: A single antenna saves mass & is a gain in simplicity but creates a critical single point of failure and forces a compromise on the frequency band.
- Conclusion: A dual-antenna architecture was selected: one primary directional antenna for high-speed payload data, and one secondary omnidirectional antenna for TT&C. This ensures that even if the satellite loses its pointing capabilities (attitude control failure), the TT&C link remains active for recovery.
¶ Frequency Bands (S-Band vs. X-Band)
Options: Operating entirely in S-Band, entirely in X-Band, or a hybrid approach.
- Justification: X-Band offers excellent data rates suitable for our payload but requires precise pointing and is highly sensitive to weather (atmospheric attenuation). It is unsuited for emergencies communications. S-Band has lower data rates but offers robust, weather-resistant propagation and allows for wider beamwidths (omnidirectional), making it perfect for critical TT&C.
- Conclusion: We selected a hybrid approach. X-Band is dedicated exclusively to the Payload downlink (high bandwidth, 1 pass/day), while S-Band is dedicated to TT&C operations (high reliability, 3 passes/day).
¶ Results
Based on the trade-offs and mission parameters, the subsystem was dimensioned using Commercial Off-The-Shelf (COTS) components. Here is an overview of the CDHS system:
¶ Data Volume and OBC Dimensioning
The total data generated per orbit is heavily dominated by the payload (∼44.7 Mbits), with TT&C contributing a fraction (∼245 kbits). Applying a safety margin factor of 5, the required storage is 28 MB.
A standard COTS OBC with dual 8 GB Industrial MicroSD cards was selected to match REQ-CDHS-3. This provides a massive storage margin while consuming only 2.0 W of nominal continuous power.
Here are the main equations used in data volume dimensioning:
Link Budget and Antenna Sizing
Transmission losses (Free Space Path Loss) were calculated based on the orbital altitude and the required data rates. The Link Budget dictated the required RF emission power:
- Main Antenna (X-Band): Requires 1 W of RF power (30 dBm) to close the link with a standard ground station, ensuring rapid payload data offloading.
- Secondary Antenna (S-Band): Requires 1 W of RF power (30 dBm) to maintain a highly robust link margin (>20dB) for TT&C.
The loss and dimensions of the antenna where derived from this equation:

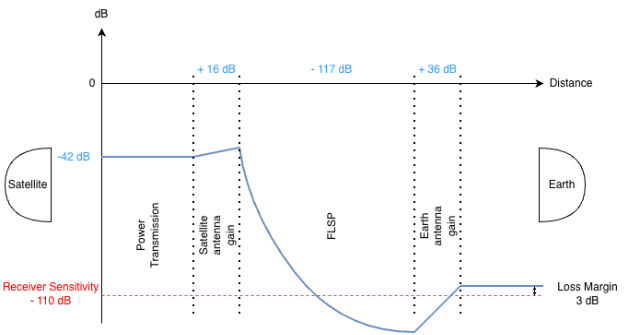
Where {P_r, min} is the receiver sensitivity, {G_earth} is the ground antenna gain, {G_sat} is the satellite antenna gain, FSPL is the free space loss, and {L_m} is the loss margin.
¶ Power and Mass Budgets
The selection of the OBC and antennas directly sized the electrical and thermal budgets:
- Mass Budget: The total mass of the C&DH and COM subsystem is kept at a strictly optimal 1.2 kg (1.3kg was allocated to CDHS).
- Electrical Power (Peak): During simultaneous transmission (Worst-Case Scenario), the system draws 8.5 W (2.0W OBC + 2.5 W X-Band + 4.0 W S-Band).
- Thermal Dissipation: The difference between electrical power consumed and RF power emitted results in a peak thermal dissipation of 6.5 W, which must be handled by the satellite's thermal control subsystem. The overall subsystem electrical efficiency during transmission peaks at 23.5%.
This last equation represents how the calculation of power budget was done:
¶ Lessons Learned
Throughout the preliminary design phase I identified this lesson:
- Theoretical link budgets calculated power needs in micro-watts, but real-world COTS transmitters require several Watts just to operate. Budgets must always be driven by actual hardware datasheets, not pure RF physics.
- Initial math suggested that 28 MB of storage was enough for payload data. However, strict customer requirements (REQ-39) demand over 400 MB to ensure safety during ground station blind spots.
¶ Power
The Power subsystem’s purpose is to provide power to all other subsystems (and itself), including power generation and power distribution. This subsystem’s design was driven by the following requirements.
¶ Requirements
- REQ-POW-01 – Eclipse Sizing: The power subsystem shall be sized to be able to operate nominally under the trajectory’s maximum eclipse times, for the complete mission duration.
- REQ-POW-02 – Peak Power Usage: The power subsystem shall be capable of delivering the combined peak power usages of each subsystem over the duration of 5 minutes, in and out of eclipses.
- REQ-POW-03 – Average Power Usage: The power subsystem shall be capable of delivering the average (across one orbit) power usage of each subsystem over the duration of one orbit.
- REQ-POW-04 – Eclipse Power Usage: The power subsystem shall be capable of delivering the average power usage of each subsystem during an eclipse.
- REQ-POW-05 – Power Storage: The secondary power system shall be able to replace the primary power system for the duration of one orbit, completing the Peak Power Usage, Average Power Usage, and Eclipse Power Usage requirements.
- REQ-POW-06 – Battery Cycling: The secondary power system shall withstand the cycling caused by eclipses.
- REQ-POW-07 – Redundant Design: The secondary power system shall be made redundant such that it can sustain one critical failure.
- REQ-POW-08 – End of Life: The power system shall be designed such that batteries can be discharged during end-of-life operations.
¶ Trade-offs and Justifications
The power subsystem has three main objectives: power generation, storage, and transmission. Power generation is often referred to as to as “primary sources,” and 3 main options exist:
- Fuel Cells: Use an electrochemical reaction to generate electricity. Fuel cells are used for short duration missions, as their size scales with the total mission amount of power required.
- Solar Arrays: Convert sunlight into electricity using photovoltaic cells. Solar arrays allow spacecraft to generate power, as opposed to fuel cells, limiting the required amount of storage. Their scalability and long lifetime make them perform better than fuel cells after a certain threshold of required power. They are used for medium duration missions, and long duration missions in which spacecraft remain close to the sun.
- Radioisotope Thermoelectric Generators (RTGs): Generator electricity from the heat released by radioactive decay using thermoelectric conversion. RTGs are often used for long duration missions as they have long lifetimes, and long-distance missions as they do not require sunlight. Their continuous power generation simplifies the power subsystem design (especially for eclipses).
Given the mission’s expected duration of 5 years and a preliminary sizing of power consumption, with the help from Space Mission Analysis and Design, solar panels were chosen as the optimal primary source for this mission.
Power storage systems are referred to as “secondary sources.” The chosen secondary source for this mission is "secondary batteries” - designating batteries that can be recharged, as opposed to primary batteries.
With these “architecture” decisions made, sizing of the subsystem had to be performed.
¶ Modeling Assumptions
To size the solar array and batteries, some important assumptions were made:
- 5 Year Mission Duration: Many variables flow from the mission duration, such as the number of eclipses setting the number of cycles for the battery, as well as solar panel decay. The power subsystem is sized to work for 5 years.
- “Worst Case” Scenario: Some calculations were made assuming the worst-case scenario, such that the spacecraft would always function nominally. Most notably, the system is sized to work for the longest eclipse-to-orbit duration ratio, even though this should only occur once during the mission.
- Electrical harness mass is assumed to be ~10% of the final spacecraft dry mass.
In addition to these assumptions, these decisions were made to “shape” the subsystem:
- With some subsystems requiring high peak power and other subsystems requiring constant average power, it was decided the batteries should be sized to deliver the peak power at any time, as well as power during eclipses, while the solar arrays would be sized to completely recharge the batteries outside of eclipses, as well as providing power outside of eclipses.
- The bus is sized for the payload voltage requirements (38.4V), meaning other subsystems include voltage regulators for their power requirements.
- Fault Tolerance Battery System: The battery system was designed with redundancy in mind, such that if one string of batteries fails, the second one can still operate the mission nominally.
Then, the main drivers of the subsystem were:
- Eclipses: their duration, especially relative to the orbit’s duration, had the highest impact on the power system. The number of eclipses also affected the battery's sizing.
- Power Budgets: Propulsion, Thermal, and AOCS had the highest power budgets – although the inputs section seems to indicate Power had a high-power budget, this budget was simply to recharge the batteries for those subsystems.
¶ Main Formulas
The main formulas used in the sizing were as follows.
For the solar array:
-
All systems provided their power budgets in Watt-hours, forming the sum of power budgets. Recharge power was found as the amount of power (in watts) required for the maximum eclipse duration and then set as “recharge power” (in watt hours) the solar panels had to generate to recharge the batteries, in the minimum out of eclipse duration.
-
This formula finds the power density output [W/m2] at the end of life of a solar panel, using mission duration (5) and the yearly degradation of the solar panel’s specific technology (power density). The “1.2” factor is used to have a 20% margin and is the only place a 20% margin was accounted for.
-
From the total power budget and End of Life Power density Output, the solar panel area is easily found, and, from there, its mass as well.
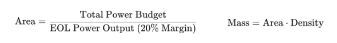
For the batteries:
-
The battery capacity is the power (W) required by subsystems over an eclipse duration, plus the thermal power, as the thermal subsystem is only active during eclipses. Conversion Efficiency is taken into account as batteries do not convert energy 100% efficiently.

-
The battery energy at BOL must be found using the previously found battery capacity, degradation factor specific to the battery technology, and a depth of discharge that depends on eclipse time and battery technology.

-
From battery energy, the mass is found with ease using the specific technology’s specific energy.
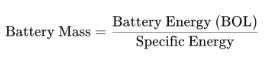
¶ Inputs and Outputs
Parameters
| Constants | |
|---|---|
| Solar Irradiance | 1360 |
| Mission Duration | 5 |
| Eclipse Time | 0.449944444 |
| Number of Cycles | 5000 |
| Orbit Time | 1.506666667 |
| Eclipse Fraction | 0.298635693 |
| Safety Factor | 2 |
| Inherent Degradation | 0.77 |
| Depth of Discharge | 0.3 |
| Number of Batteries | 3 |
| Bus Voltage | 36 |
| Thermal Peak Power | 75 |
| Thermal Power Usage | 33.74583333 |
Subsystem Power Inputs
| Subsystem | Peak Power [W] | Orbit Power [Wh] | Power [W] | Recharge Power [W] |
|---|---|---|---|---|
| CDH | 8.5 | 2.0 | 1.3 | - |
| AOCS | 80.3 | 24.0 | 15.9 | - |
| Power | - | - | - | 296.2 |
| Payload | 29 | 43.6 | 19.2 | |
| Propulsion | 264 | 397.7 | 264 | - |
| Total Power | 381.8 | 467.5 | 310.3 | 727.8 |
Solar Array Calculations
| Solar Cell Type | Silicon | Gallium Arsenide | Multijunction |
|---|---|---|---|
| Yearly Degradation | 0.037 | 0.027 | 0.005 |
| Efficiency [-] | 0.14 | 0.18 | 0.22 |
| Power density Output [W/m2] | 154.98 | 193.73 | 230.38 |
| Power density EOL [W/m2] | 128.02 | 168.51 | 224.68 |
| 20% Margin | 128.02 | 168.51 | 224.68 |
| Area [m2] | 4.73 | 3.59 | 2.69 |
| Density [kg/m2] | 12.5 | 2.5 | 1.25 |
| Weight [kg] | 59.22 | 8.99 | 3.37 |
Battery Calculations
With a battery capacity of 347.8Wh, found using the above formula and the subsystem power inputs:
| Solar Cell Type | Silicon | Gallium Arsenide | Multijunction |
|---|---|---|---|
| Battery Type | Li-ion | LiFePO4 | NiH2 |
| Battery Peak Power | 424.30 | 424.30 | 424.30 |
| EOL Retained Capacity | 0.8 | 0.8 | 0.85 |
| Depth of Discharge | 0.7 | 0.8 | 0.775 |
| Battery Energy (BOL) | 1242.08 | 1086.82 | 1055.89 |
| Nominal Cell Voltage | 3.6 | 3.2 | 1.2 |
| Number of Cells | 10 | 12 | 30 |
| Battery Capacity (Ah) | 34.50 | 28.30 | 29.33 |
| 2 String Capacity | 17.25 | 14.15 | 14.66 |
| Peak Current | 11.78 | 11.04 | 11.78 |
| Peak Current/String | 5.89 | 5.52 | 5.89 |
| C-Rate (1 Failed String) | 0.68 | 0.78 | 0.80 |
| C-Rate(Healthy) | 0.34 | 0.39 | 0.40 |
| Total Cells | 20 | 24 | 60 |
| Specific Energy (Wh/kg) | 180 | 205 | 60.6 |
| Mass [kg] | 6.90 | 5.30 | 17.42 |
¶ Results
With these outputs, using different technologies for both solar arrays and batteries, multijunction solar panels were chosen as the standard in space applications, even though they cost significantly more than Gallium Arsenide. For batteries, both Li-ion and LiFePO4 batteries could be chosen with an only 1.6kg difference, but Li-ion technology’s maturity for space applications was deemed preferable.
The final system outputs are:
Multi Junction Solar Panels
- 2.7m2
- 3.37kg
Li-Ion Batteries
- 6.9kg
Harnessing
- 26kg
For a total mass of 36.5kg.
The subsystem also includes power control, for this mission, Direct Energy Transfer was used as the shunt regulators can be used for EOL battery emptying, it is extremely efficient, and a quasi-regulated system functions for the spacecraft’s purposes.
¶ Lessons Learned
- The Orbit and Trajectory team is absolutely critical, from the earliest moment of the project. Not only do they have direct impact on the power system through the number and duration of eclipses, but the entire trajectory will impact every other system, and – to the exception of Structures and Mechanisms and Configuration –, in doing so, indirectly impacts the Power system.
- This phase of design is not about “finding the right answer.” I don’t mean you’re trying to find the wrong answer, but the phase focuses on estimating values, and through iteration, converging a value, and assuming this value is a sufficiently good estimate, given it has converged. This was, initially, hard to come to terms with, but seems to be the core of concurrent engineering in its initial phases.
- Essentially everything done in the Power system is a “lesson learned,” as I knew absolutely nothing about the Power system, having avoided it in every other class.
- Knowing when to accommodate other subsystems’ wants/needs and when to enforce your subsystem's’ wants/needs is very important, as some seemingly “small” tweaks in one subsystem can have cascading effects elsewhere.
- The calculation sheets can and should be prepared before subsystems reporting any coherent values. While it is hard to start working without any inputs (for me), the calculations can be prepared in the Excel spreadsheet, and, as other subsystems fill in their data on COMET, errors will show up, and work can continue.
- COMET has very poor UI/UX, however, when variables are properly pushed and subscribed to, the Excel sheets work like a charm. Maximizing the Excel functionality while keeping the COMET clutter minimal is ideal for a good workflow.
¶ Thermal
The thermal subsystem is responsible for maintaining all spacecraft components and subsystems within their operational temperature limits throughout the mission lifecycle. In the space environment, where convective cooling is absent, the thermal subsystem must manage heat dissipation exclusively through radiation to space while simultaneously protecting sensitive equipment from extreme solar and planetary radiation. Effective thermal control is fundamental to mission success, as component degradation and structural integrity are all sensitive to temperature excursions beyond design limits.
¶ Requirements
- REQ-TH-01 - TOF-MS Operating Temperature: The thermal control system shall maintain the TOF-MS instrument within its operating temperature range of -15°C to +40°C throughout all mission phases.
- REQ-TH-02 – Dust Counter Operating Temperature: The thermal control system shall maintain the dust counter within its operating temperature range of -30°C to +55°C throughout all mission phases.
- REQ-T-03 – Thermal Stability for Dust Counter: Temperature gradients across the dust counter piezoelectric sensor shall be minimized to reduce thermally-induced noise in impact measurements.
- REQ-T-04 – Thermal Design Across Altitudes : The thermal control system shall maintain all components within their allowable temperature ranges across the full altitude range (500 km to maximum orbit), accounting for varying Earth albedo and IR flux.
¶ Trade-offs and Justifications
Two distinct approaches were envisaged during the generation of the system :
Passive system
-
Description
- Dissipation (REQ-TH-04)
- Heatpipes + passive radiator in satellite shadow
- Temperature range (REQ-TH-01 / REQ-TH-02 / REQ-TH-03)
- Heater on radiator
- Gradient (REQ-TH-02)
- White coating
- Dissipation (REQ-TH-04)
-
Pros
- Lightweight
- Cheap
- Easy interface management (one heatpipe per assembly)
-
Cons
- Limited dissipation capability
- Poor efficiency (heater attached to the radiator)
- Dependent on good system coordination (AOCS for shadow, structure + configuration for radiator size and location).
Active system
-
Description
- Dissipation (REQ-TH-04)
- Ammonia loop + pump + active radiator
- Temperature range (REQ-TH-01 / REQ-TH-02 / REQ-TH-03)
- Heaters spread amongst the assemblies
- Gradient (REQ-TH-02)
- Muli Layer Insulation (MLI)
- Dissipation (REQ-TH-04)
-
Pros
- Very high adaptability
- High dissipation capability
- High insulation
-
Cons
- Complex (mechanisms, fluid loops)
- Costly
- Complicated interface management (continuous fluid loop going through multiple subsystems).
The passive architecture presented three potential drawbacks: limited dissipation capacity, poor heater efficiency due to radiator-side placement, and dependency on system-level coordination for shadow orientation and radiator sizing. However, none of these were binding in practice: total system dissipation was low, the structure provided adequate aluminum panel area, AOCS and trajectory design delivered thermally favorable orientations and orbits, and heater power consumption remained within power subsystem margins.
Given the program’s tight mass and cost constraints and already complex interface landscape, the passive system was selected.
¶ Modelling
¶ Assumptions
To model the thermal behavior of the satellite we made the following assumptions :
- The system is reduced to two massless lumps : radiator and solar panels.
- There is no internal thermal resistance (perfect conduction)
- The system is dimensioned for the most constraint environment (longest eclipse).
- Steady states are computed for sunlit and eclipse scenarios.
- Transient is derived from steady states by pondering them.
- Solar panels temperatures are not accounting for their power draw (worst case scenario).
¶ Main Formulas
Dissipation is modelled as:
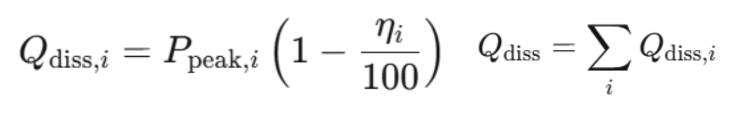
Earth view factor is approximated for a circular orbit:
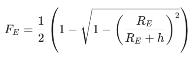
Solar array temperature, satellite sunlit temperature and eclipse transient temperature (in Celsius) are computed using the following formulas :
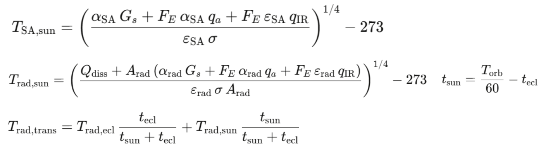
Where alpha and epsilon represent the absorptivity and emissivity of the body, Gs and q are environment heat flux and dissipation, Arad is the radiating area, t is duration.
¶ Results
¶ Main Drivers
As the thermal behavior of the satellite is constrained by its environment and its embedded assemblies, eclipse duration and the total dissipation were the main drivers, directly impacting the radiator specifications and overall sizing.
¶ Architecture
The thermal subsystem uses a hub-and spoke architecture where the hub is the radiator (an aluminum structure panel located at the satellite’s bottom) with its heater, and the spokes are the heat pipes going from the radiator / heater combo to each dissipating assembly of the satellite. The solar arrays are treated as independent hubs.
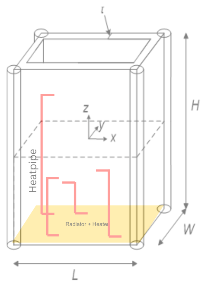
Figure 14 Simplified view of the radiator / heater + heatpipes layout
Radiation predominates, coming from the earth (Albedo + IR) and the sun (IR). Dissipation coming from the other subsystems is transported to the radiator by the heatpipes and expelled through radiation to deep space. A similar pattern is visible solar panel-side.
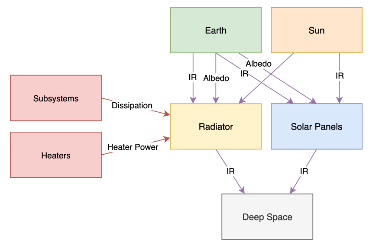
Figure 15 Thermal model diagram
Inputs
Outputs
The table above summarizes the thermal subsystem performance. In the worst-case scenario, the radiator can dissipate 216.9W of power and the heater produce about 75W during eclipse, keeping the satellite’s subsystems within their respective temperature ranges (cf. “Within Temp Range ? section).
A quick price analysis was run as a bonus, but it should be discarded, as very preliminary and not accounting for system-level developments.
The satellite’s temperature oscillates between -7.4°C and 47.6°C, while the solar panels have a broader temperature range, between -80.8°C and 109.8°C.
Given this, with the latest inputs the thermal subsystem is compliant with its four technical requirements.
¶ Lessons Learned
- Thermal modelling can be hard to tackle at first, but in the end it’s just about what’s going in (Earth IR, Earth Albedo, Sun Radiation), out (Body Radiation) and “through” (subsystems dissipations). Once you have those powers identified and modelled, it gets easier.
- Outwards coating properties (absorptivity and emissivity) have a huge impact on the satellite temperatures.
- Designing a simple system is beneficial both for the system and subsystem development.
- Thermal design is more about “auditing” than “designing”, you make sure that every subsystem stays within their temperature range, but they own the main design drivers.
- COMET is a great tool with poor ergonomics. Focus on delivering the variables that really matter to the other subsystems, keep the other locally. In the end there is very little variables that should be pushed to COMET (mass, volume…) but many that must be imported from COMET (dissipations, efficiencies, material properties…).
¶ Space Sustainability
¶ Requirements
- REQ-SUS-01 (European Launcher): The mission shall launch on a sustainable European vehicle.
- REQ-SUS-02 (Post-Mission Disposal): The spacecraft shall comply with ESA debris mitigation guidelines and perform disposal within 5 years.
- REQ-SUS-03 (Demisability): Materials shall be selected to minimize fragments upon atmospheric re-entry.
¶ Trade-offs and Justifications
Launcher Selection:
A trade-off was conducted to select the most suitable and sustainable launch vehicle, driven by the customer's requirement to use a European launcher.
- New vs. Heritage Launchers: Emerging European micro-launchers (such as Isar Aerospace, Maia Space or RFA) were initially considered. However, they were discarded due to a lack of available payload configuration manuals and flight heritage required for this phase of the design. The trade-off was therefore narrowed down to established systems: Vega-C and Ariane 6.
- Sustainability Profile (Ariane 62 vs. Vega-C): Vega-C relies heavily on solid propulsion stages, which emit higher levels of pollutants into the atmosphere. That’s why Ariane 62 was selected as the optimal choice. While it uses solid rocket boosters, its core and upper stages utilize liquid propellants (Liquid Oxygen and Liquid Hydrogen), which present a cleaner emissions profile. The Ariane 6 upper stage also features the Vinci engine, allowing for a dedicated de-orbit maneuver of the upper stage itself, reducing the creation of orbital debris.
Figure 16 Launcher Choice Diagram
End of Life:
Several EoL disposal strategies were evaluated to safely remove the spacecraft from its orbit:
- Drag-augmentation device aka sail: A deployable drag sail would accelerate atmospheric re-entry by increasing the effective cross-sectional area of the spacecraft. While it requires low [Equation], adding a sail introduces unnecessary mass and a mechanical failure point.
- Controlled re-entry: A precise re-entry would minimize ground risks. However, this approach demands a significant [Equation] reserve and a high-thrust propulsion system at end-of-life, neither of which is compatible with the constrained wet mass and the propulsion architecture.
- Natural decay + Design-for-Demise (D4D): The selected strategy involves using the remaining propellant at EoL to lower the perigee to approximately 300 km, where the atmospheric drag ensures natural re-entry within the 5-year goal. This approach requires a highly manageable [Equation] allocation.
The D4D strategy was retained as the balance between mass budget impact and system simplicity.
¶ Results
Demisability Assessment:
During atmospheric re-entry, a spacecraft typically experiences peak heating at altitudes between 70 and 80 km, where aerodynamic deceleration generates surface temperatures exceeding 1600°C. Components are considered demisable if their melting point falls well below this threshold and their geometry promotes early fragmentation and ablation.
Since the majority of the spacecraft is aluminum, the heat of atmospheric re-entry will melt the structure away. The only minor concern lies with the steel rotors inside the reaction wheels due to their high melting point. However, because each rotor weighs less than 1 kg, any surviving fragments would be too small to pose a risk to people on Earth, complying with the ESA's 15-Joule safety threshold.
Figure 17 Material Demisability Table
Collision risk:
Although computational constraints prevented the use of the ESA MASTER software, the collision probability was analytically approximated using the following formula:
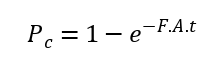
Where:
- F = spatial flux of debris [objects/m²/s] at the mission altitude
- A = effective cross-sectional area of the spacecraft [m²]
- t = mission duration [s]
The spatial flux was approximated using the MASTER reference populate from the ESA Space Environment 2025:
Figure 18 ESA Space Environment 2025 : Density of space objects larger than 10 and 1 cm (including active satellites)
As shown in the results table, the worst-case scenario occurs at transit at 800 km (known as a congested region). Despite this, the collision risk remains low and well within safety margins.
Figure 19 Collision Probability Table
¶ Lessons Learned
- Role Definition Sustainability + SE: The dual role of SB and SE led to a dissipation of focus. Big amount of time was redirected toward supporting systems engineering tasks, which delayed progress on sustainability .
- What I would do differently if I could: Clear boundaries must be established from the beginning and defining a sustainability framework - Team Dynamics: Working in a multi-disciplinary team showed how interconnected the design of a mission is. It was a great experience to see the project advance through collective effort, but the dependency between the sub-systems also created challenges. As students with limited experience, it was often difficult to make definitive choices when one decision (like the launcher) relied entirely on another (like the trajectory). This circular dependency meant that when one person hesitated, the whole team’s kind of stalled. So maybe having someone guide us to set a “hard-freeze” on some parameters would allow the team to move forward faster.
- Sustainability Scope: Unlike the other poles, the SB workload is quite broad and less defined, making it easy to get lost in lots of things that could be done and then not having the time to finish. Help with establishing a clear scope at the start is needed to avoid being overwhelmed by the options.
¶ Budgets (system level)
¶ Trade-off and Justifications
Three system-level trade-offs locked the design envelope before the subsystems could converge: orbit architecture, launcher selection, and the budgeting strategy itself.
¶ Orbit Architecture: Retrograde Molniya vs. Circular Dusk–Dawn SSO
Two architectures were carried into the trade: a retrograde Molniya orbit and a circular dusk–dawn SSO. From an SE perspective the decision was driven by the system-level cost of each option rather than by science alone. The Molniya orbit roughly doubled the ΔV budget (driving propellant mass and tank volume), pushed the wet mass beyond any rideshare envelope, and demanded distributed radiation hardening to cope with repeated Van Allen transits, while the dusk–dawn SSO sat naturally inside the European rideshare manifest and kept the radiation and thermal environment benign for every other subsystem. The SSO was selected; the orbital mechanics, altitude profile, and ΔV breakdown are detailed in the Trajectory Analysis section (SCI-12, REQ-26).
¶ Launcher Selection
REQ-02 restricts the mission to a European launcher, leaving Vega-C and Ariane 62 (rideshare or dedicated) as the realistic candidates. Once the bottom-up dry mass settled in the 250–270 kg range — well below either dedicated capacity — the SE-level trade collapsed to a cost-and-schedule comparison: a dedicated Vega-C slot (≈ 60–80 M€) versus an Ariane 62 shared SSO slot priced at Arianespace's indicative ~10 k€/kg rideshare tariff (≈ 5–7 M€ all in). Ariane 62 rideshare was selected, freeing roughly 60 M€ that flows directly into the cost reserve and the 35 M€ payload pre-allocation. The flight-environment, sustainability, and deployment-orbit case for the choice is detailed in the Space Sustainability section.
¶ Budgeting Strategy: Top-Down Allocation vs. Bottom-Up Roll-Up
Two budgeting philosophies were on the table. A pure top-down allocation distributes a fixed mission mass to subsystems based on heritage fractions, forcing the design to converge against a hard envelope; a pure bottom-up roll-up sums first-principle subsystem estimates and lets the platform mass emerge, at the risk of running away from any launcher-compatible target. STARDUST adopted a hybrid strategy. The first iteration was top-down, anchored on the IBEX (Interstellar Boundary Explorer) heritage mission — a NASA Small Explorer whose compact in-situ particle instrument suite closely matches the STARDUST TOF-MS plus piezo dust counter, making its per-subsystem mass fractions a credible first reference. This produced Target 1: 90.9 kg dry, 125.6 kg of xenon, 216.6 kg wet — small enough for a dedicated small-launcher slot in the spirit of IBEX itself. Once each discipline produced its first bottom-up estimate the dry mass climbed to 238.4 kg, dominated by the “Battleship” radiation-shielded primary structure (156 kg) that absorbed every other subsystem's vault and by a redundant power chain (32 kg). Forcing the design back to 90 kg would have meant abandoning the Battleship or restoring localized radiation hardening across every subsystem; neither was acceptable in Phase A. The allocation was therefore re-opened: the launcher trade was revisited (REQ-02) and Ariane 62 in shared configuration was retained, lifting the rideshare envelope to roughly 300 kg per passenger to dusk–dawn SSO. A second target (Target 2: 266.6 kg allowable dry mass) was then negotiated jointly with Trajectory and Propulsion against a hard physical constraint — the maximum xenon volume that two 40 L commercial COPVs can hold (125.6 kg of Xe) caps the achievable Δv, and back-solving the rocket equation against the 5-year mission Δv yields 266.6 kg as the largest dry mass the propulsion subsystem can fly. The hybrid converged: top-down envelopes from the launcher and the propellant volume, bottom-up roll-up from the subsystems, with a uniform 10 % system-level margin on top of subsystem contingencies in line with ESA Phase 0/A practice.
¶ Results
The system-level budgets (mass, power, cost) close out the Systems Engineering outputs and form the contractual interface between SE and the subsystem teams.
¶ Mass Budget
The mass budget was the central system-level convergence variable and went through three distinct allocation regimes, summarized in Figure 20 and Figure 21. The target dry mass (Figure 20) opens at ~90 kg, set by the IBEX-heritage top-down allocation and a small-launcher first cut. It then jumps to 300 kg once the launcher trade settled on Ariane 62 rideshare, whose shared SSO capacity comfortably accommodates several hundred kilograms per passenger and gave the subsystems room to close their bottom-up estimates without wholesale re-design. A final downward step to ~266 kg occurs when the propulsion bottom-up closes: a pair of 40 L commercial xenon COPVs caps the propellant at 125.6 kg, and back-solving the rocket equation against the 5-year Δv budget yields 266.6 kg as the maximum dry mass the propulsion subsystem can fly. The total spacecraft mass evolution (Figure 21) shows the matching bottom-up trajectory: it crosses 118 kg in the first roll-up (top-down stub, payload and propulsion only), rises to ~210 kg as the Battleship structure is sized against radiation, climbs through the 235–260 kg corridor as the redundant power chain, harness, and AOCS converge, and finally stabilises around 260–266 kg under the Target 2 envelope. Two subsystem decisions dominate the bottom-up roll-up. Structures and mechanisms grow to 156 kg (≈ 65 % of dry mass) once the Battleship strategy of consolidating all radiation shielding into a single thick aluminium primary structure is adopted, eliminating localised vaults in CDH, propulsion electronics, and AOCS; the power chain then settles around 31.7 kg (≈ 13 %), with the harness alone (~23.6 kg) being the second-largest single contributor on the spacecraft, a direct consequence of the redundant TT&C and payload power buses required for a 5-year science mission. Conversely, the budget actively shaped the subsystem designs. The 266.6 kg dry-mass cap drove propulsion to a single Hall-effect thruster sized at the lowest power class compatible with the Δv (~265 W PPU), eliminated the option of titanium structural elements in favour of an Al 7075-T6 / 6061-T6 / honeycomb 2024-T3 stack, constrained AOCS to a low-mass reaction-wheel set without dedicated thrusters, and forced thermal control to a passive-only architecture. The final allocation (Table 20) closes at 262.2 kg dry / 387.9 kg wet with 10 % system-level margin on top of subsystem contingencies, leaving 4.4 kg of margin against the Target 2 envelope and a wet mass that is compatible with both Vega-C and Ariane 62 rideshare manifests.
Figure 20 Target dry-mass evolution across the system-level negotiations: Target 1 at ~90 kg (IBEX-heritage top-down, small-launcher first cut), 300 kg envelope after the move to Ariane 62 rideshare, and final Target 2 at 266.6 kg set by the 40 L COPV xenon-volume cap.
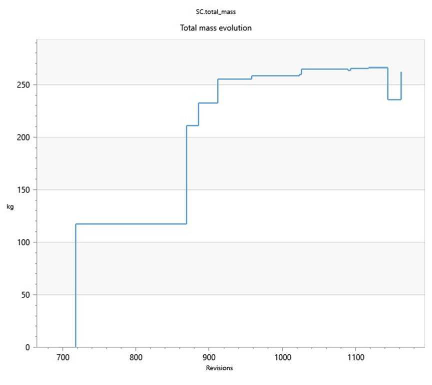
Figure 21 Total spacecraft mass evolution from the bottom-up roll-up: first stub at ~118 kg, jump to ~210 kg with the Battleship structure, convergence through the 235–260 kg corridor as the power chain, harness, and AOCS close, and stabilisation in the 260–266 kg band.
| Subsystem | Mass [kg] | Share of dry [%] |
|---|---|---|
| Payload (TOF-MS + dust counter) | 20 | 8.4 |
| AOCS | 8.18 | 3.4 |
| Structures and Mechanisms | 156.14 | 65.5 |
| Propulsion (dry) | 20.09 | 8.4 |
| Power (incl. harness) | 31.74 | 13.3 |
| Thermal | 1.03 | 0.4 |
| C&DH / Communications | 1.2 | 0.5 |
| Dry mass subtotal | 238.38 | 100 |
| System-level margin (10%) | 23.84 | — |
| Total dry mass (with margin) | 262.22 | — |
| Propellant (Xe + cold gas) | 125.64 | — |
| Total wet mass | 387.85 | — |
Table 2 Final mass budget per subsystem, with system-level margin.
¶ Power Budget
The power chain is sized for worst-case eclipse with all nominal loads active: the solar arrays (2.25 m² of multi-junction GaAs) deliver 225 W at end-of-life and must recharge the battery during the shortest daylight pass of the dusk–dawn SSO. The battery (LiFePO₄, 12s2p, 28 Ah, 1100 Wh BOL) absorbs the peak load and covers the full eclipse duration. The propulsion string (PPU, ~265 W) is the dominant consumer during the spiral phases; during those arcs the payloads may be inhibited to protect the bus from plasma contamination (REQ-33). At least 20% margin on generated EOL power is preserved (REQ-46).
¶ Cost Budget
The 170 M€ cap (REQ-05) and the 35 M€ payload pre-allocation (REQ-08) bound the budget. The remaining lines are built bottom-up from the 387.85 kg wet mass (Table 2), the Ariane 62 rideshare tariff (REQ-02) and parametric CERs calibrated on SMEX-class heritage (IBEX, DESTINY+).
Launch is sized on the Arianespace indicative rideshare rate of ~10 k€/kg to SSO: 387.85 kg × 10 k€/kg ≈ 3.9 M€ raw, rising to 5 – 7 M€ once the integration premium, insurance and campaign support are added — well inside the 60 – 80 M€ envelope that a Vega-C dedicated slot would have required.
The nominal lines sum to 150 M€, leaving a 20 M€ system-level cost reserve (≈ 13 %) consistent with ESA Phase-A guidance for an SMEX-class mission. The allocation is summarised in Table 3.
| Cost line | Nominal [M€] | Range [M€] | Share [%] |
|---|---|---|---|
| Payload (fixed, REQ-08) | 35 | 35 | 20.6 |
| Launch services (Ariane 62 rideshare) | 6 | 5 – 7 | 3.5 |
| Spacecraft platform (hardware) | 73 | 68 – 78 | 42.9 |
| Xenon propellant (125.6 kg) | 0.5 | 0.3 – 0.6 | 0.3 |
| AIT and environmental campaign | 7 | 6 – 8 | 4.1 |
| Ground segment (capex + 5 yr service) | 8 | 7 – 9 | 4.7 |
| Flight operations (commissioning + 5 yr) | 8.5 | 7 – 10 | 5 |
| Project management, SE, PA, docs | 12 | 10 – 14 | 7.1 |
| Nominal sub-total | 150 | — | 88.2 |
| System-level cost reserve (≈ 13 %) | 20 | — | 11.8 |
| Mission cost cap (REQ-05) | 170 | — | 100 |
Table 3 Phase-A cost decomposition for STARDUST; ranges are the residual uncertainty absorbed by the reserve.
The dominant sensitivity is the dry mass: any slip beyond ~550 kg wet would push STARDUST off the rideshare tariff and towards a 15 – 20 M€ dedicated small-launcher slot. The risk is tracked as PM-01.
¶ Lessons learned
Acting as the Systems Engineer for STARDUST highlighted a handful of lessons that transcend the individual subsystems:
- Early mass allocations are hypotheses, not contracts. The 90 kg dry target taken from IBEX heritage was unreachable once the Battleship structure was chosen; renegotiating the target (Target 2: 266.6 kg) was cheaper than forcing every subsystem against a fictitious number.
- The Battleship is a clear example of system-level coupling: doubling the structural mass let every other subsystem drop its local shielding, which lowered overall integration risk. Each subsystem alone would have rejected the mass increase.
- Margins are a design parameter, not a safety net. The uniform 10 % system margin on top of subsystem contingencies kept the wet mass within reach of both reference launchers and absorbed late changes without re-opening the budgets.
- Once the dry mass settled, the launcher trade became a cost trade rather than a technical one. Ariane 62 rideshare freed roughly 60 M€ over a Vega-C dedicated slot; that money is now the cost reserve.
¶ Technical Lessons Learned
For general lessons learned about concurrent engineering, go to the useful_tips page (accessible to eSpace staff only).
Subsystems' lessons learnt are directly added in the sections above.
¶ Conclusion
This study carried out a Phase 0/A concurrent design of STARDUST, a mission to characterize the flux, chemical composition, and orbital distribution of sub-micrometer cosmic dust and anthropogenic debris at altitudes between 500 and 2,000 km. The work was conducted over a series of engineering sessions within the ENG-411 Concurrent Engineering course at EPFL, following the ESA Concurrent Design Facility methodology.
The study converged on a technically coherent solution. A 387.9 kg wet-mass spacecraft carrying a TOF-MS impact ionization instrument and a piezoelectric dust counter is inserted by Ariane 62 rideshare into a 500 km dusk–dawn Sun-synchronous orbit. A Xenon Hall Effect thruster system raises the orbit in a continuous low-thrust spiral to 2,000 km over approximately 2.75 years, before descending symmetrically for the remainder of the five-year science mission. The circular SSO was selected over a retrograde Molniya option primarily on cost and power grounds: the permanent solar illumination eliminates deep-discharge battery cycling, and the rideshare-compatible insertion avoids the expense of a dedicated launcher. A “Battleship” structural philosophy: a 1.2 cm aluminium 7075-T6 skin acting as a monolithic radiation vault, resolves the challenging MEO radiation environment without individual shielding vaults on each subsystem, at the cost of a structurally dominant dry mass. The total mission cost is estimated at 150 M€ against a 170 M€ cap, with a 20 M€ system-level reserve.
All major subsystem interfaces converged within the study timeline. The mass budget closed at 262.2 kg dry (versus a 266.6 kg allowable), the power chain is sized for worst-case eclipse with 20% end-of-life margin, and the spacecraft complies with ESA debris mitigation guidelines through a Design-for-Demise end-of-life strategy targeting natural re-entry from 300 km within five years.
Several cross-cutting themes emerged consistently across all subsystems and reflected the nature of concurrent engineering itself.
The single most important structural insight was that every design decision is a system-level decision. Accepting the Battleship skin mass more than doubled the structural allocation but eliminated radiation vaults from every other subsystem, collapsing integration risk across the board. Relocating the solar arrays from the lateral faces to a front-facing arm resolved a payload contamination risk and an instrument flip-maneuver conflict simultaneously, but only because Configuration, AOCS, and Propulsion were iterating together in real time. The 180° spacecraft rotation required at the ascending-to-descending science transition, an operationally critical maneuver, was identified late because the concept of operations had not been diagrammed early enough. This caused a cascade of late design changes that consumed time all teams could not afford. A clear, shared ConOps diagram from day one would have surfaced the issue in the first session.
The role of a single authoritative source of truth, the COMET parameter catalogue, proved its value every time a subsystem updated a value outside it, as a divergence appeared within one or two iterations. The flip side was equally instructive: COMET’s poor ergonomics meant that teams who did not invest time in correctly pushing and subscribing to variables found themselves working from stale local sheets. The tool is only as consistent as the discipline with which teams use it.
Concurrent engineering also exposed how much of spacecraft design is negotiation rather than optimization. The Systems Engineer’s core task was translating subsystem updates into budget consequences and feeding them back as constraints that every other team could design against. The first mass allocation (90.9 kg dry) was a hypothesis that became untenable once the shielding strategy was chosen; reopening it transparently, rather than forcing unrealistic subsystem targets, allowed the design to converge honestly. Similarly, the propulsion engineer ultimately set the dry mass ceiling, not the systems engineer, because the propellant tank volume dictated the allowable structural envelope. These reversals are normal and healthy in a concurrent process; what matters is that they are communicated quickly and documented clearly.
At the process level, the study reinforced that Phase 0/A is fundamentally about convergence, not accuracy. Every number in this report is an estimate, and the goal was to arrive at estimates that are mutually consistent and physically plausible, not to pre-empt Phase B analysis. Where assumptions were made, trajectory distribution of dust particles, station-keeping budget derived from literature, thermal model reduced to two lumped masses, the subsections document them explicitly so that a follow-on study knows exactly where to invest modelling effort first.
Looking ahead, the three areas warranting the most attention in a Phase B study are the delta-V budget (combining plane-change and altitude-change maneuvers into simultaneous burns is expected to reduce the 3,641 m/s total significantly), the AOCS sensor suite (redundancy was not fully addressed in this phase), and the mass budget margin on the structural subsystem, which absorbs the bulk of the spacecraft mass and leaves limited headroom for design maturation.
STARDUST emerges from this study as a feasible and scientifically compelling mission. The concurrent design process demonstrated both its strengths, speed of iteration, forced interface discipline, early identification of cross-cutting trades, and its demands: the need for a shared frame of reference, honest re-baselining when early allocations prove unreachable, and the discipline to zoom out and consider the system as a whole before optimizing any single subsystem.
¶ Acknowledgments
We would like to thank Mathieu Udriot and Marnix Verkammen for their supervision, Stephan Hellmich, Andrew Price and Abdullah Feyzi for the continuous feedback and Veerle Sterken for the client’s needs discussions.